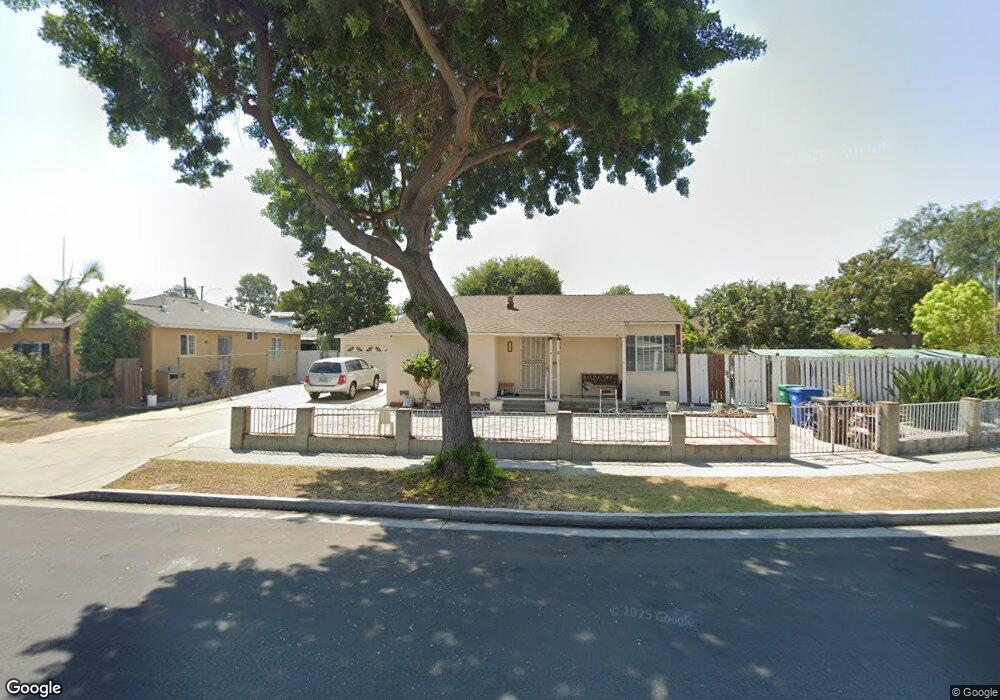
660 E Silva St Long Beach, CA 90807
Bixby Knolls NeighborhoodEstimated Value: $738,000 - $821,000
2
Beds
1
Bath
962
Sq Ft
$800/Sq Ft
Est. Value
About This Home
This home is located at 660 E Silva St, Long Beach, CA 90807 and is currently estimated at $769,154, approximately $799 per square foot. 660 E Silva St is a home located in Los Angeles County with nearby schools including Barton Elementary School, Lindbergh STEM Academy, and Jordan High School.
Ownership History
Date
Name
Owned For
Owner Type
Purchase Details
Closed on
Mar 8, 2025
Sold by
Luong Vannguyen Chau and Hue Nguyen Lily
Bought by
Chau Luong Van Nguyen And Lily Hue Nguyen Fam and Van Nguyen
Current Estimated Value
Purchase Details
Closed on
Feb 17, 1998
Sold by
Lanting Jerry J and Lanting Cornelia
Bought by
Vannguyen Chau Luong and Nguyen Lily Hue
Home Financials for this Owner
Home Financials are based on the most recent Mortgage that was taken out on this home.
Original Mortgage
$121,500
Interest Rate
7.06%
Purchase Details
Closed on
Sep 10, 1997
Sold by
Va
Bought by
Lanting Jerry J and Lanting Cornelia
Purchase Details
Closed on
Jun 9, 1997
Sold by
Norwest Mtg Inc
Bought by
Va
Purchase Details
Closed on
Jun 6, 1997
Sold by
Manuel B D Attilio Garcia Arlene and Norwest Mtg Inc
Bought by
Norwest Mtg Inc
Create a Home Valuation Report for This Property
The Home Valuation Report is an in-depth analysis detailing your home's value as well as a comparison with similar homes in the area
Home Values in the Area
Average Home Value in this Area
Purchase History
| Date | Buyer | Sale Price | Title Company |
|---|---|---|---|
| Chau Luong Van Nguyen And Lily Hue Nguyen Fam | -- | None Listed On Document | |
| Vannguyen Chau Luong | $135,000 | American Title Co | |
| Lanting Jerry J | $101,000 | American Title | |
| Va | -- | Fidelity National Title Ins | |
| Norwest Mtg Inc | $100,294 | Fidelity National Title Ins |
Source: Public Records
Mortgage History
| Date | Status | Borrower | Loan Amount |
|---|---|---|---|
| Previous Owner | Vannguyen Chau Luong | $121,500 |
Source: Public Records
Tax History
| Year | Tax Paid | Tax Assessment Tax Assessment Total Assessment is a certain percentage of the fair market value that is determined by local assessors to be the total taxable value of land and additions on the property. | Land | Improvement |
|---|---|---|---|---|
| 2025 | $2,989 | $215,533 | $119,105 | $96,428 |
| 2024 | $2,989 | $211,308 | $116,770 | $94,538 |
| 2023 | $2,937 | $207,166 | $114,481 | $92,685 |
| 2022 | $2,768 | $203,105 | $112,237 | $90,868 |
| 2021 | $2,708 | $199,124 | $110,037 | $89,087 |
| 2019 | $2,669 | $193,220 | $106,774 | $86,446 |
| 2018 | $2,481 | $189,432 | $104,681 | $84,751 |
| 2016 | $2,283 | $182,078 | $100,617 | $81,461 |
| 2015 | $2,194 | $179,344 | $99,106 | $80,238 |
| 2014 | $2,185 | $175,832 | $97,165 | $78,667 |
Source: Public Records
Map
Nearby Homes
- 5050 Linden Ave Unit 62
- 5050 Linden Ave Unit 75
- 5050 Linden Ave Unit 97
- 400 E Arbor St Unit 1
- 472 E Sunset St
- 4865 Elm Ave
- 1071 E 46th St
- 1124 E Ridgewood St
- 5174 Linden Ave
- 312 E Peace St
- 309 E Silva St
- 496 E 52nd St
- 242 E Del Amo Blvd
- 5021 Brayton Ave
- 496 E 53rd St
- 4820 Long Beach Blvd
- 345 E 53rd St
- 5381 Olive Ave
- 1414 E Silva St
- 12 W Pleasant St
Your Personal Tour Guide
Ask me questions while you tour the home.