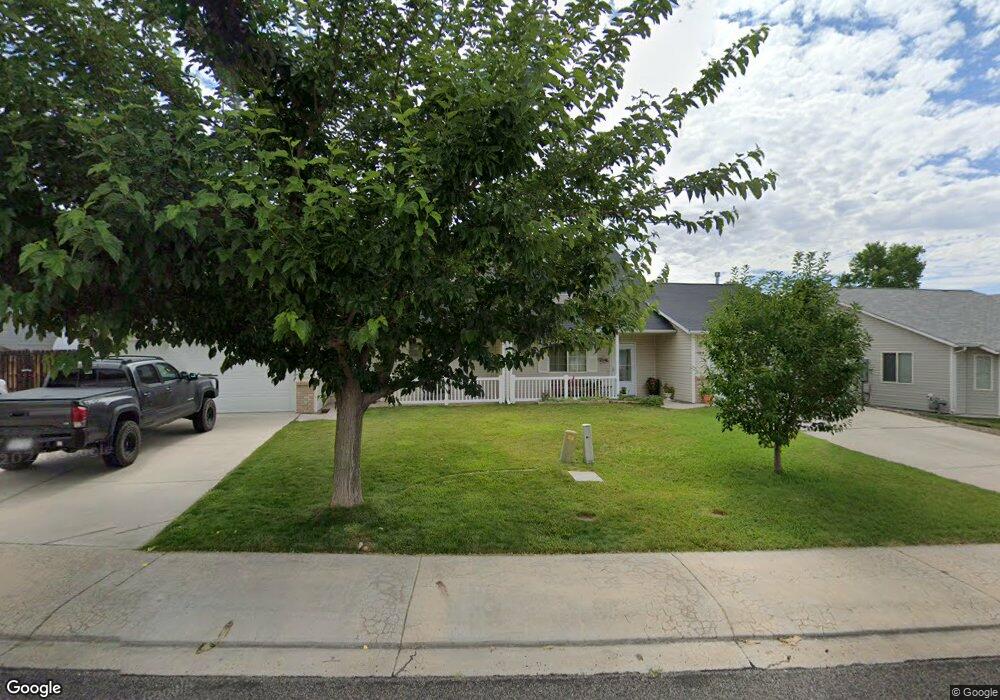
660 Springbrook Dr Grand Junction, CO 81504
Northeast Grand Junction NeighborhoodEstimated Value: $319,000 - $336,000
3
Beds
3
Baths
1,187
Sq Ft
$274/Sq Ft
Est. Value
About This Home
This home is located at 660 Springbrook Dr, Grand Junction, CO 81504 and is currently estimated at $325,529, approximately $274 per square foot. 660 Springbrook Dr is a home located in Mesa County with nearby schools including Thunder Mountain Elementary School, Bookcliff Middle School, and Central High School.
Ownership History
Date
Name
Owned For
Owner Type
Purchase Details
Closed on
Feb 1, 2010
Sold by
Imb Reo Llc
Bought by
Johnson Ronald S
Current Estimated Value
Home Financials for this Owner
Home Financials are based on the most recent Mortgage that was taken out on this home.
Original Mortgage
$143,256
Outstanding Balance
$97,014
Interest Rate
5.5%
Mortgage Type
FHA
Estimated Equity
$228,515
Purchase Details
Closed on
Jul 17, 2007
Sold by
Hokanson Ed
Bought by
Baldwin Jonnie L
Home Financials for this Owner
Home Financials are based on the most recent Mortgage that was taken out on this home.
Original Mortgage
$137,250
Interest Rate
6.54%
Mortgage Type
Purchase Money Mortgage
Purchase Details
Closed on
Jun 26, 2003
Sold by
Darter Llc
Bought by
Hokanson Ed
Home Financials for this Owner
Home Financials are based on the most recent Mortgage that was taken out on this home.
Original Mortgage
$91,460
Interest Rate
5.27%
Mortgage Type
Purchase Money Mortgage
Create a Home Valuation Report for This Property
The Home Valuation Report is an in-depth analysis detailing your home's value as well as a comparison with similar homes in the area
Home Values in the Area
Average Home Value in this Area
Purchase History
| Date | Buyer | Sale Price | Title Company |
|---|---|---|---|
| Johnson Ronald S | $145,900 | Assured Title | |
| Baldwin Jonnie L | $183,000 | Land Title Guarantee Company | |
| Hokanson Ed | $114,325 | Meridian Land Title Llc |
Source: Public Records
Mortgage History
| Date | Status | Borrower | Loan Amount |
|---|---|---|---|
| Open | Johnson Ronald S | $143,256 | |
| Previous Owner | Baldwin Jonnie L | $137,250 | |
| Previous Owner | Hokanson Ed | $91,460 |
Source: Public Records
Tax History
| Year | Tax Paid | Tax Assessment Tax Assessment Total Assessment is a certain percentage of the fair market value that is determined by local assessors to be the total taxable value of land and additions on the property. | Land | Improvement |
|---|---|---|---|---|
| 2024 | $546 | $13,320 | $3,940 | $9,380 |
| 2023 | $546 | $13,320 | $3,940 | $9,380 |
| 2022 | $597 | $14,190 | $3,820 | $10,370 |
| 2021 | $599 | $14,600 | $3,930 | $10,670 |
| 2020 | $803 | $10,600 | $2,860 | $7,740 |
| 2019 | $764 | $10,600 | $2,860 | $7,740 |
| 2018 | $832 | $10,630 | $2,880 | $7,750 |
| 2017 | $805 | $10,630 | $2,880 | $7,750 |
| 2016 | $752 | $11,110 | $2,790 | $8,320 |
Source: Public Records
Map
Nearby Homes
- 657 Springbrook Dr
- 2972 Summerbrook Dr
- 0 Tbd Unit 829372
- 647 1/2 Meadowood Ct
- 670 Jax Ct
- 2940 Braxton Ct
- 631 1/2 Pioneer Rd
- 639 Mount Julian Dr
- 639 Aspenwood Ln
- 2949 Erika Rd
- 635 Aspenwood Ln
- 668 Strathearn Dr
- 696 Arran Way Unit B
- 696 Arran Way Unit A
- 692 Arran Way Unit B
- 694 Arran Way Unit A
- 657 Starlight Dr
- 678 Medhurst Ln
- 690 Strathearn Dr Unit A
- 3010 F 3 4 Rd
- 658 Springbrook Dr
- 662 Springbrook Dr
- 661 1/2 Springbrook Dr
- 661 Springbrook Dr
- 0 Springbrook Dr Unit 631058
- 0 Springbrook Dr Unit 633881
- 0 Springbrook Dr Unit 639698
- 659 Springbrook Dr
- 663 Springbrook Dr
- 663 1/2 Springbrook Dr
- 2977 Babbling Brook Dr
- 668 Springbrook Dr
- 2979 Babbling Brook Dr
- 665 Springbrook Dr
- 2964 Brookside Dr
- 665 1/2 Springbrook Dr
- 655 Springbrook Dr
- 0 Babbling Brook Dr Unit 612718
- 0 Babbling Brook Dr Unit 624368
- 0 Babbling Brook Dr Unit 642748
Your Personal Tour Guide
Ask me questions while you tour the home.