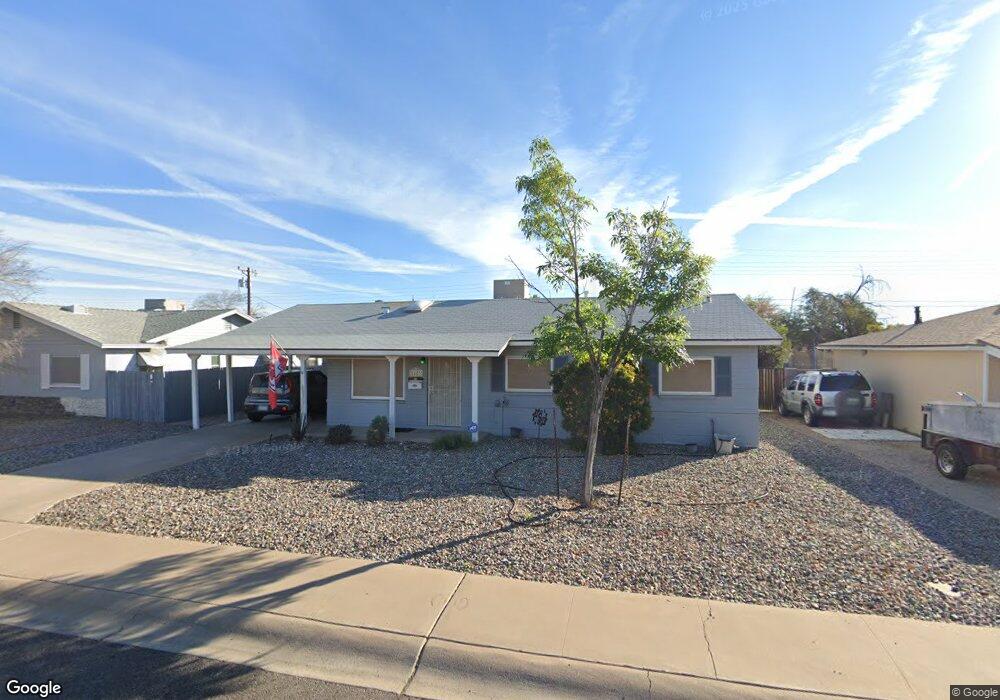
6603 N 20th Ave Phoenix, AZ 85015
Alhambra NeighborhoodEstimated Value: $310,000 - $400,000
4
Beds
2
Baths
1,635
Sq Ft
$216/Sq Ft
Est. Value
About This Home
This home is located at 6603 N 20th Ave, Phoenix, AZ 85015 and is currently estimated at $352,597, approximately $215 per square foot. 6603 N 20th Ave is a home located in Maricopa County with nearby schools including Maryland Elementary School, Washington High School, and CASA Academy.
Ownership History
Date
Name
Owned For
Owner Type
Purchase Details
Closed on
Aug 13, 2008
Sold by
Bank Of New York
Bought by
Fitch Julia A
Current Estimated Value
Home Financials for this Owner
Home Financials are based on the most recent Mortgage that was taken out on this home.
Original Mortgage
$135,547
Outstanding Balance
$88,701
Interest Rate
6.27%
Mortgage Type
FHA
Estimated Equity
$263,896
Purchase Details
Closed on
Apr 23, 2008
Sold by
Ramirez Luis O and Ramirez Naomy
Bought by
Bank Of New York and Cwabs Inc Asset Backed Notes Series 2006
Purchase Details
Closed on
Aug 31, 2001
Sold by
Baca Bonnie L
Bought by
Ramirez Luis O and Ramirez Naomy
Home Financials for this Owner
Home Financials are based on the most recent Mortgage that was taken out on this home.
Original Mortgage
$117,946
Interest Rate
7.05%
Mortgage Type
FHA
Create a Home Valuation Report for This Property
The Home Valuation Report is an in-depth analysis detailing your home's value as well as a comparison with similar homes in the area
Home Values in the Area
Average Home Value in this Area
Purchase History
| Date | Buyer | Sale Price | Title Company |
|---|---|---|---|
| Fitch Julia A | $137,000 | First American Title Ins Co | |
| Bank Of New York | $121,500 | First American Title | |
| Ramirez Luis O | $119,000 | Security Title Agency |
Source: Public Records
Mortgage History
| Date | Status | Borrower | Loan Amount |
|---|---|---|---|
| Open | Fitch Julia A | $135,547 | |
| Previous Owner | Ramirez Luis O | $117,946 | |
| Closed | Ramirez Luis O | $4,000 |
Source: Public Records
Tax History
| Year | Tax Paid | Tax Assessment Tax Assessment Total Assessment is a certain percentage of the fair market value that is determined by local assessors to be the total taxable value of land and additions on the property. | Land | Improvement |
|---|---|---|---|---|
| 2025 | $1,210 | $10,856 | -- | -- |
| 2024 | $1,141 | $10,339 | -- | -- |
| 2023 | $1,141 | $27,200 | $5,440 | $21,760 |
| 2022 | $1,100 | $20,060 | $4,010 | $16,050 |
| 2021 | $1,128 | $19,360 | $3,870 | $15,490 |
| 2020 | $1,098 | $16,010 | $3,200 | $12,810 |
| 2019 | $1,078 | $14,320 | $2,860 | $11,460 |
| 2018 | $1,047 | $13,720 | $2,740 | $10,980 |
| 2017 | $1,044 | $11,650 | $2,330 | $9,320 |
| 2016 | $1,026 | $11,410 | $2,280 | $9,130 |
| 2015 | $951 | $9,430 | $1,880 | $7,550 |
Source: Public Records
Map
Nearby Homes
- 6501 N 20th Ave
- 6565 N 19th Ave Unit 45
- 6565 N 19th Ave Unit 36
- 6565 N 19th Ave Unit 27
- 1828 W Tuckey Ln Unit 8
- 1833 W Citrus Way
- 1842 W Marlette Ave
- 1742 W Stella Ln
- 2014 W Lawrence Rd
- 1701 W Tuckey Ln Unit 216
- 1701 W Tuckey Ln Unit 206
- 1701 W Tuckey Ln Unit 138
- 1701 W Tuckey Ln Unit 231
- 1820 W Claremont St
- 6501 N 17th Ave Unit 108
- 1702 W Tuckey Ln Unit 209
- 1702 W Tuckey Ln Unit 230
- 2048 W Claremont St
- 2107 W Marlette Ave
- 6215 N 21st Dr
- 6533 N 20th Ave
- 6609 N 20th Ave
- 6602 N 19th Dr
- 6532 N 19th Dr
- 6527 N 20th Ave
- 6615 N 20th Ave
- 6608 N 19th Dr
- 6602 N 20th Ave
- 6608 N 20th Ave
- 6532 N 20th Ave
- 6526 N 19th Dr
- 6614 N 19th Dr Unit 3
- 6614 N 20th Ave
- 6621 N 20th Ave
- 6521 N 20th Ave
- 6526 N 20th Ave
- 6620 N 19th Dr
- 6520 N 19th Dr
- 6620 N 20th Ave
- 6520 N 20th Ave
Your Personal Tour Guide
Ask me questions while you tour the home.