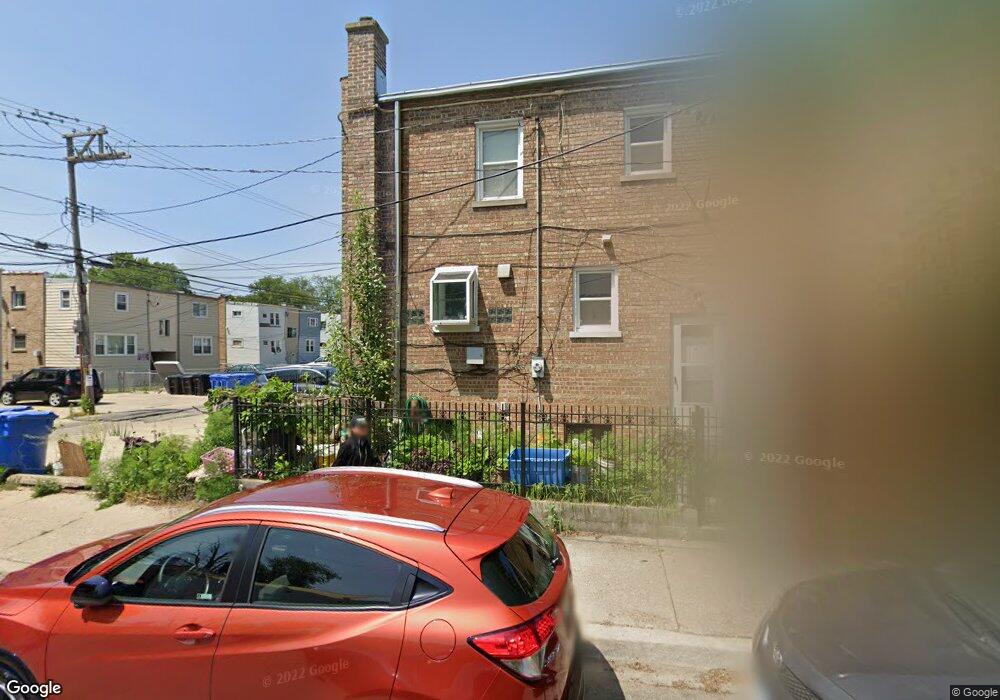
6604 N Damen Ave Chicago, IL 60645
West Ridge NeighborhoodEstimated Value: $329,000 - $490,000
3
Beds
3
Baths
1,440
Sq Ft
$260/Sq Ft
Est. Value
About This Home
This home is located at 6604 N Damen Ave, Chicago, IL 60645 and is currently estimated at $374,355, approximately $259 per square foot. 6604 N Damen Ave is a home located in Cook County with nearby schools including George Armstrong Elementary School, Sullivan High School, and God's Battle Axe Prayer Academy.
Ownership History
Date
Name
Owned For
Owner Type
Purchase Details
Closed on
Jun 10, 2008
Sold by
Fremont Investment & Loan
Bought by
Ngo Huy Xuan
Current Estimated Value
Purchase Details
Closed on
Oct 3, 2007
Sold by
Laqui Christopher
Bought by
Fremont Investment & Loan
Purchase Details
Closed on
Jul 10, 2006
Sold by
Chua Peter T and Chua Mae Anne P
Bought by
Laqui Christopher
Home Financials for this Owner
Home Financials are based on the most recent Mortgage that was taken out on this home.
Original Mortgage
$228,000
Interest Rate
8.85%
Mortgage Type
Unknown
Purchase Details
Closed on
Sep 25, 2003
Sold by
Chua Mae Anne P and Chua Peter
Bought by
Chua Peter T and Chua Mae Anne P
Home Financials for this Owner
Home Financials are based on the most recent Mortgage that was taken out on this home.
Original Mortgage
$180,000
Interest Rate
7.4%
Mortgage Type
Unknown
Create a Home Valuation Report for This Property
The Home Valuation Report is an in-depth analysis detailing your home's value as well as a comparison with similar homes in the area
Home Values in the Area
Average Home Value in this Area
Purchase History
| Date | Buyer | Sale Price | Title Company |
|---|---|---|---|
| Ngo Huy Xuan | $215,000 | 1St American Title | |
| Fremont Investment & Loan | -- | None Available | |
| Laqui Christopher | $285,000 | Pntn | |
| Chua Peter T | -- | Pntn |
Source: Public Records
Mortgage History
| Date | Status | Borrower | Loan Amount |
|---|---|---|---|
| Previous Owner | Laqui Christopher | $228,000 | |
| Previous Owner | Chua Peter T | $180,000 | |
| Closed | Chua Peter T | $45,000 |
Source: Public Records
Tax History Compared to Growth
Tax History
| Year | Tax Paid | Tax Assessment Tax Assessment Total Assessment is a certain percentage of the fair market value that is determined by local assessors to be the total taxable value of land and additions on the property. | Land | Improvement |
|---|---|---|---|---|
| 2024 | $4,106 | $30,000 | $4,426 | $25,574 |
| 2023 | $3,982 | $22,779 | $3,541 | $19,238 |
| 2022 | $3,982 | $22,779 | $3,541 | $19,238 |
| 2021 | $3,911 | $22,778 | $3,540 | $19,238 |
| 2020 | $3,492 | $18,780 | $3,343 | $15,437 |
| 2019 | $3,494 | $20,821 | $3,343 | $17,478 |
| 2018 | $3,434 | $20,821 | $3,343 | $17,478 |
| 2017 | $3,452 | $19,409 | $2,950 | $16,459 |
| 2016 | $3,387 | $19,409 | $2,950 | $16,459 |
| 2015 | $3,076 | $19,409 | $2,950 | $16,459 |
| 2014 | $2,850 | $17,930 | $2,753 | $15,177 |
| 2013 | $2,783 | $17,930 | $2,753 | $15,177 |
Source: Public Records
Map
Nearby Homes
- 6561 N Seeley Ave
- 2025 W Arthur Ave Unit C2
- 1937 W Pratt Blvd Unit 2N
- 6500 N Ridge Blvd Unit 4E
- 2111 W Arthur Ave Unit 1S
- 6433 N Damen Ave Unit 3E
- 6421 N Damen Ave Unit 1W
- 6414 N Hoyne Ave Unit 3W
- 2065 W Farwell Ave Unit 20653N
- 6801 N Wolcott Ave
- 6423 N Leavitt St
- 6457 N Bell Ave Unit 2
- 1749 W North Shore Ave
- 2130 W Farwell Ave
- 1745 W North Shore Ave
- 7518 N Ridge Ave Unit 1E
- 2217 W Farwell Ave Unit 2B
- 2036 W Morse Ave Unit D
- 2245 W Farwell Ave Unit 3B
- 1958 W Morse Ave Unit B
- 6602 N Damen Ave
- 6606 N Damen Ave
- 6608 N Damen Ave
- 6600 N Damen Ave
- 6600 N Damen Ave Unit 1
- 6610 N Damen Ave
- 6560 N Damen Ave
- 6616 N Damen Ave Unit 2N
- 6616 N Damen Ave Unit 1N
- 6614 N Damen Ave Unit 1S
- 6601 N Seeley Ave Unit 2
- 6603 N Seeley Ave Unit 2N
- 6558 N Damen Ave
- 6605 N Seeley Ave Unit 66051
- 6605 N Seeley Ave Unit 66052
- 6605 N Seeley Ave Unit 1S
- 6607 N Seeley Ave Unit 2N
- 6607 N Seeley Ave Unit 66072
- 6607 N Seeley Ave Unit 66071
- 6607 N Seeley Ave Unit 1N