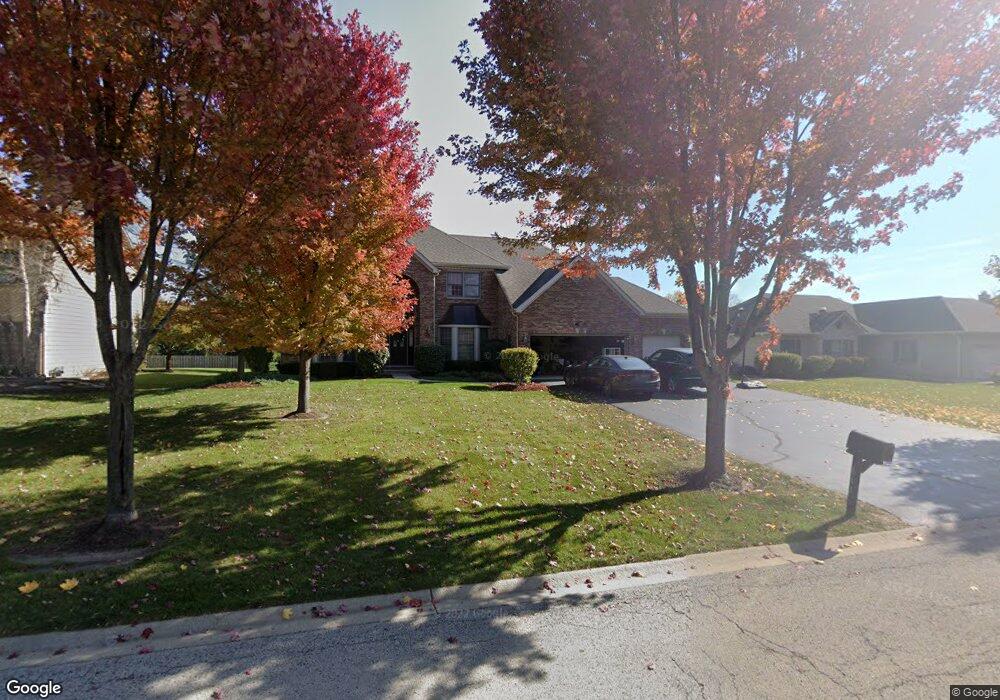
661 Clover Dr Algonquin, IL 60102
Far West Algonquin NeighborhoodEstimated Value: $648,205 - $683,000
5
Beds
5
Baths
3,737
Sq Ft
$177/Sq Ft
Est. Value
About This Home
This home is located at 661 Clover Dr, Algonquin, IL 60102 and is currently estimated at $661,051, approximately $176 per square foot. 661 Clover Dr is a home located in McHenry County with nearby schools including Mackeben Elementary School, Conley Elementary School, and Heineman Middle School.
Ownership History
Date
Name
Owned For
Owner Type
Purchase Details
Closed on
Sep 26, 2008
Sold by
Homesales Inc
Bought by
Sowder Denise and Sowder John
Current Estimated Value
Home Financials for this Owner
Home Financials are based on the most recent Mortgage that was taken out on this home.
Original Mortgage
$210,000
Interest Rate
6.19%
Mortgage Type
Purchase Money Mortgage
Purchase Details
Closed on
May 9, 2008
Sold by
Jun Jae Sook
Bought by
Homesales Inc
Purchase Details
Closed on
Aug 4, 2005
Sold by
Home State Bank Na
Bought by
Jun Sung K and Jun Jae S
Home Financials for this Owner
Home Financials are based on the most recent Mortgage that was taken out on this home.
Original Mortgage
$359,650
Interest Rate
5.69%
Mortgage Type
Fannie Mae Freddie Mac
Purchase Details
Closed on
Mar 1, 2004
Sold by
Algonquin State Bank
Bought by
Home State Bank Na
Create a Home Valuation Report for This Property
The Home Valuation Report is an in-depth analysis detailing your home's value as well as a comparison with similar homes in the area
Home Values in the Area
Average Home Value in this Area
Purchase History
| Date | Buyer | Sale Price | Title Company |
|---|---|---|---|
| Sowder Denise | $386,000 | Forum Title Insurance Co | |
| Homesales Inc | -- | Wheatland Title Guaranty | |
| Jun Sung K | $505,948 | Ticor | |
| Home State Bank Na | -- | -- |
Source: Public Records
Mortgage History
| Date | Status | Borrower | Loan Amount |
|---|---|---|---|
| Previous Owner | Sowder Denise | $210,000 | |
| Previous Owner | Jun Sung K | $359,650 |
Source: Public Records
Tax History Compared to Growth
Tax History
| Year | Tax Paid | Tax Assessment Tax Assessment Total Assessment is a certain percentage of the fair market value that is determined by local assessors to be the total taxable value of land and additions on the property. | Land | Improvement |
|---|---|---|---|---|
| 2024 | $13,230 | $187,819 | $17,702 | $170,117 |
| 2023 | $12,866 | $168,720 | $15,902 | $152,818 |
| 2022 | $12,209 | $153,633 | $14,480 | $139,153 |
| 2021 | $11,808 | $144,691 | $13,637 | $131,054 |
| 2020 | $11,637 | $140,832 | $13,273 | $127,559 |
| 2019 | $11,336 | $137,236 | $12,934 | $124,302 |
| 2018 | $13,034 | $153,380 | $14,556 | $138,824 |
| 2017 | $12,902 | $144,548 | $13,718 | $130,830 |
| 2016 | $13,030 | $137,429 | $13,042 | $124,387 |
| 2013 | -- | $131,568 | $19,726 | $111,842 |
Source: Public Records
Map
Nearby Homes
- 3750 Wintergreen Terrace
- Rainier Plan at Westview Crossing
- Bryce Plan at Westview Crossing
- Biscayne Plan at Westview Crossing
- Sequoia Plan at Westview Crossing
- Santa Rosa Plan at Westview Crossing
- Adams Plan at Westview Crossing
- 4020 Bunker Hill Dr
- 374 W Point Cir
- 900 Treeline Dr
- 940 Treeline Dr
- 3756 Innesbrook Ct
- 4351 Bunker Hill Dr
- 9105 Algonquin Rd
- 2660 Harnish Dr
- 16 Springbrook Ln
- 3260 Nottingham Dr
- 480 Brookside Ave
- 11320 Wild Ridge Ln
- 11320 Wildridge Ln
- 671 Clover Dr
- 680 Bluestem Ln
- 690 Bluestem Ln
- 641 Clover Dr
- 681 Clover Dr
- 640 Clover Dr
- 700 Bluestem Ln
- 650 Clover Dr
- 630 Clover Dr
- 660 Bluestem Ln
- 631 Clover Dr
- 660 Clover Dr
- 620 Clover Dr
- 710 Bluestem Ln Unit 5
- 650 Bluestem Ln
- 3801 Wintergreen Terrace Unit 4
- 621 Clover Dr
- 610 Clover Dr
- 651 Bluestem Ln
- 661 Bluestem Ln