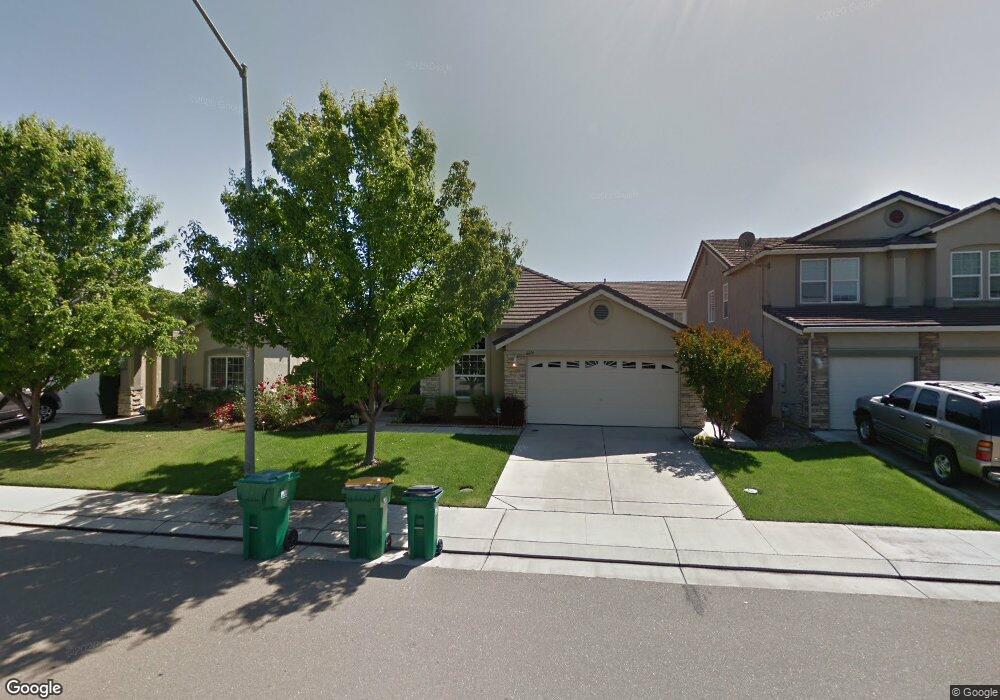
6614 Crestview Cir Unit 21 Stockton, CA 95219
Spanos Park West NeighborhoodEstimated Value: $489,000 - $517,000
3
Beds
2
Baths
1,940
Sq Ft
$258/Sq Ft
Est. Value
About This Home
This home is located at 6614 Crestview Cir Unit 21, Stockton, CA 95219 and is currently estimated at $499,722, approximately $257 per square foot. 6614 Crestview Cir Unit 21 is a home located in San Joaquin County with nearby schools including Manlio Silva Elementary School, Christa McAuliffe Middle School, and Bear Creek High School.
Ownership History
Date
Name
Owned For
Owner Type
Purchase Details
Closed on
Nov 4, 2020
Sold by
Menor Rosalinda and Cabingabang Viadimir Menor
Bought by
Cabingabang Vladimir Menor
Current Estimated Value
Home Financials for this Owner
Home Financials are based on the most recent Mortgage that was taken out on this home.
Original Mortgage
$215,000
Outstanding Balance
$191,663
Interest Rate
2.9%
Mortgage Type
New Conventional
Estimated Equity
$308,059
Purchase Details
Closed on
Jun 6, 2012
Sold by
Menor Rosalinda
Bought by
Menor Rosalinda and Cabingabang Vladimir Menor
Purchase Details
Closed on
Aug 11, 2004
Sold by
Kimball Hill Homes California Inc
Bought by
Menor Rosalinda
Home Financials for this Owner
Home Financials are based on the most recent Mortgage that was taken out on this home.
Original Mortgage
$215,750
Interest Rate
6.17%
Mortgage Type
Purchase Money Mortgage
Create a Home Valuation Report for This Property
The Home Valuation Report is an in-depth analysis detailing your home's value as well as a comparison with similar homes in the area
Home Values in the Area
Average Home Value in this Area
Purchase History
| Date | Buyer | Sale Price | Title Company |
|---|---|---|---|
| Cabingabang Vladimir Menor | -- | Chicago Title Company | |
| Menor Rosalinda | -- | None Available | |
| Menor Rosalinda | $316,000 | First Amer Title Co |
Source: Public Records
Mortgage History
| Date | Status | Borrower | Loan Amount |
|---|---|---|---|
| Open | Cabingabang Vladimir Menor | $215,000 | |
| Closed | Menor Rosalinda | $215,750 |
Source: Public Records
Tax History
| Year | Tax Paid | Tax Assessment Tax Assessment Total Assessment is a certain percentage of the fair market value that is determined by local assessors to be the total taxable value of land and additions on the property. | Land | Improvement |
|---|---|---|---|---|
| 2025 | $6,229 | $440,095 | $131,016 | $309,079 |
| 2024 | $6,058 | $431,467 | $128,448 | $303,019 |
| 2023 | $6,015 | $423,008 | $125,930 | $297,078 |
| 2022 | $5,899 | $414,714 | $123,461 | $291,253 |
| 2021 | $5,991 | $406,584 | $121,041 | $285,543 |
| 2020 | $5,867 | $402,416 | $119,800 | $282,616 |
| 2019 | $5,747 | $394,526 | $117,451 | $277,075 |
| 2018 | $5,665 | $386,792 | $115,149 | $271,643 |
| 2017 | $5,082 | $337,000 | $100,000 | $237,000 |
| 2016 | $4,476 | $288,000 | $86,000 | $202,000 |
| 2014 | $3,945 | $239,000 | $72,000 | $167,000 |
Source: Public Records
Map
Nearby Homes
- 6282 Crestview Cir
- 10525 Lake Point Ave
- 5948 Pebblestone Way
- 5916 Pebblestone Way
- 10816 Merritt Dr
- 10908 Monomoy Way
- 5849 Silveroak Cir
- 5914 Silveroak Cir
- 10933 Monomoy Way
- 5759 Westchester Cir
- 10412 Rubicon Ave
- 10918 Miacomet Ct
- 10324 Almanor Cir
- 6641 Kaweah Ln
- 10363 Shorecliff St
- 6628 Kaweah Ln
- 6814 Oyster Point Ln
- 5820 Lagrande Way
- 10313 Ultar Dr
- 10362 Baldy Dr
- 6610 Crestview Cir
- 6618 Crestview Cir
- 6656 Crestview Cir
- 6598 Crestview Cir
- 6662 Crestview Cir
- 6661 Crestview Cir
- 6342 Arrowood Ct
- 6590 Crestview Cir
- 6611 Crestview Cir
- 6617 Crestview Cir
- 6607 Crestview Cir
- 6334 Arrowood Ct
- 6647 Crestview Cir
- 6625 Crestview Cir
- 6643 Crestview Cir
- 6668 Crestview Cir
- 6597 Crestview Cir
- 6653 Crestview Cir
- 6582 Crestview Cir
- 6635 Crestview Cir
Your Personal Tour Guide
Ask me questions while you tour the home.