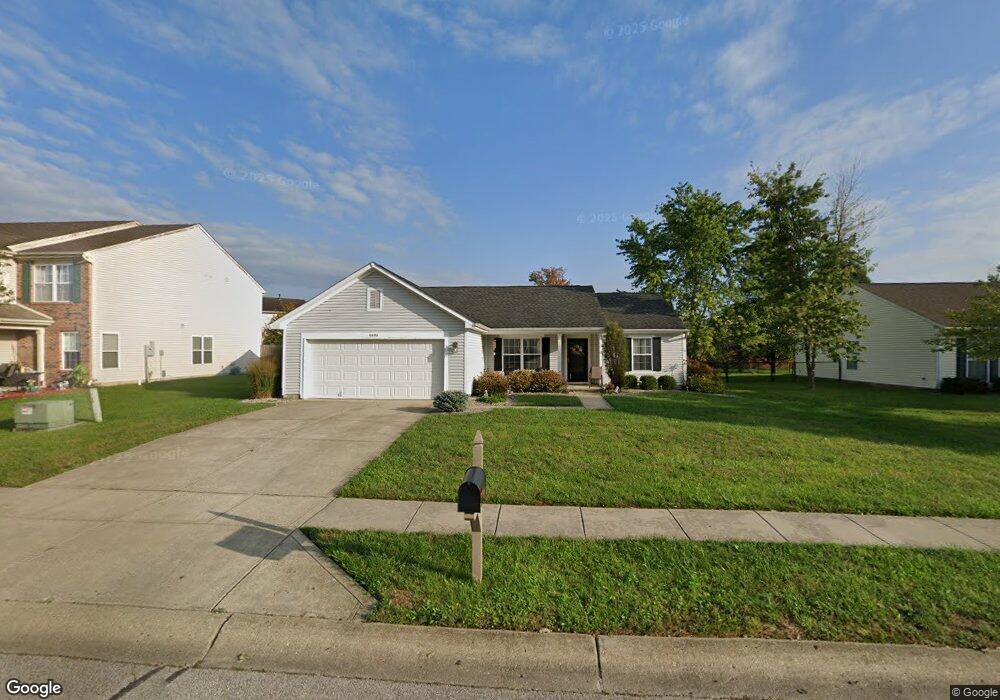
6626 Captiva Pass Plainfield, IN 46168
Estimated Value: $265,000 - $309,000
3
Beds
2
Baths
1,589
Sq Ft
$176/Sq Ft
Est. Value
About This Home
This home is located at 6626 Captiva Pass, Plainfield, IN 46168 and is currently estimated at $279,727, approximately $176 per square foot. 6626 Captiva Pass is a home located in Hendricks County with nearby schools including Clarks Creek Elementary, Plainfield Community Middle School, and Plainfield High School.
Ownership History
Date
Name
Owned For
Owner Type
Purchase Details
Closed on
Jul 17, 2015
Sold by
Haas John L
Bought by
Creech Eva
Current Estimated Value
Home Financials for this Owner
Home Financials are based on the most recent Mortgage that was taken out on this home.
Original Mortgage
$110,000
Outstanding Balance
$86,337
Interest Rate
4.05%
Mortgage Type
New Conventional
Estimated Equity
$193,390
Purchase Details
Closed on
Jan 17, 2007
Sold by
Meunier Stephanie A
Bought by
Haas John L
Purchase Details
Closed on
Nov 29, 2006
Sold by
Secretary Of Hud
Bought by
Meunier Stephanie A
Purchase Details
Closed on
Jul 7, 2006
Sold by
Countrywide Homes Loans Inc
Bought by
Secretary Of Hud
Purchase Details
Closed on
Apr 20, 2006
Sold by
Countrywide Home Loans In
Bought by
Jones Gorden C
Create a Home Valuation Report for This Property
The Home Valuation Report is an in-depth analysis detailing your home's value as well as a comparison with similar homes in the area
Home Values in the Area
Average Home Value in this Area
Purchase History
| Date | Buyer | Sale Price | Title Company |
|---|---|---|---|
| Creech Eva | -- | -- | |
| Haas John L | -- | None Available | |
| Meunier Stephanie A | -- | Village Title Inc | |
| Secretary Of Hud | -- | None Available | |
| Jones Gorden C | -- | None Available |
Source: Public Records
Mortgage History
| Date | Status | Borrower | Loan Amount |
|---|---|---|---|
| Open | Creech Eva | $110,000 | |
| Closed | Haas John L | $0 |
Source: Public Records
Tax History
| Year | Tax Paid | Tax Assessment Tax Assessment Total Assessment is a certain percentage of the fair market value that is determined by local assessors to be the total taxable value of land and additions on the property. | Land | Improvement |
|---|---|---|---|---|
| 2024 | $1,885 | $214,800 | $44,400 | $170,400 |
| 2023 | $1,600 | $191,800 | $39,700 | $152,100 |
| 2022 | $1,589 | $178,700 | $36,700 | $142,000 |
| 2021 | $1,318 | $154,300 | $33,400 | $120,900 |
| 2020 | $1,311 | $153,500 | $33,400 | $120,100 |
| 2019 | $1,186 | $144,800 | $31,200 | $113,600 |
| 2018 | $1,188 | $142,200 | $31,200 | $111,000 |
| 2017 | $1,108 | $132,000 | $30,000 | $102,000 |
| 2016 | $1,057 | $128,500 | $30,000 | $98,500 |
| 2014 | $1,050 | $125,600 | $29,400 | $96,200 |
| 2013 | $1,009 | $118,900 | $28,500 | $90,400 |
Source: Public Records
Map
Nearby Homes
- 6608 Dunsdin Dr
- 6588 Dunsdin Dr
- 5853 Gadsen Dr
- 5586 Gibbs Rd
- ALWICK Plan at Trescott - Gardens
- PARKETTE Plan at Trescott - Gardens
- ALDEN Plan at Trescott - Gardens
- SHELBURN Plan at Trescott - Gardens
- MAJESTIC Plan at Trescott - Overlook
- MAJESTIC Plan at Trescott - Gardens
- BUCHANAN Plan at Trescott - Overlook
- CRESTVIEW Plan at Trescott - Gardens
- VANDERBURGH Plan at Trescott - Gardens
- VANDERBURGH Plan at Trescott - Overlook
- AYDEN Plan at Trescott - Overlook
- BELLEVILLE Plan at Trescott - Overlook
- HORIZON Plan at Trescott - Gardens
- SHELBURN Plan at Trescott - Overlook
- ALDEN Plan at Trescott - Overlook
- BELLEVILLE Plan at Trescott - Gardens
- 6630 Captiva Pass
- 6622 Captiva Pass
- 6627 Dunsdin Dr
- 6629 Dunsdin Dr
- 6621 Dunsdin Dr
- 6634 Captiva Pass
- 6618 Captiva Pass
- 6625 Dunsdin Dr
- 6635 Dunsdin Dr
- 5835 Kiah Ct
- 6631 Dunsdin Dr
- 6623 Dunsdin Dr
- 6633 Dunsdin Dr
- 6619 Dunsdin Dr
- 6631 Captiva Pass
- 6637 Dunsdin Dr
- 6638 Captiva Pass
- 6614 Captiva Pass
- 5839 Kiah Ct
- 6635 Captiva Pass