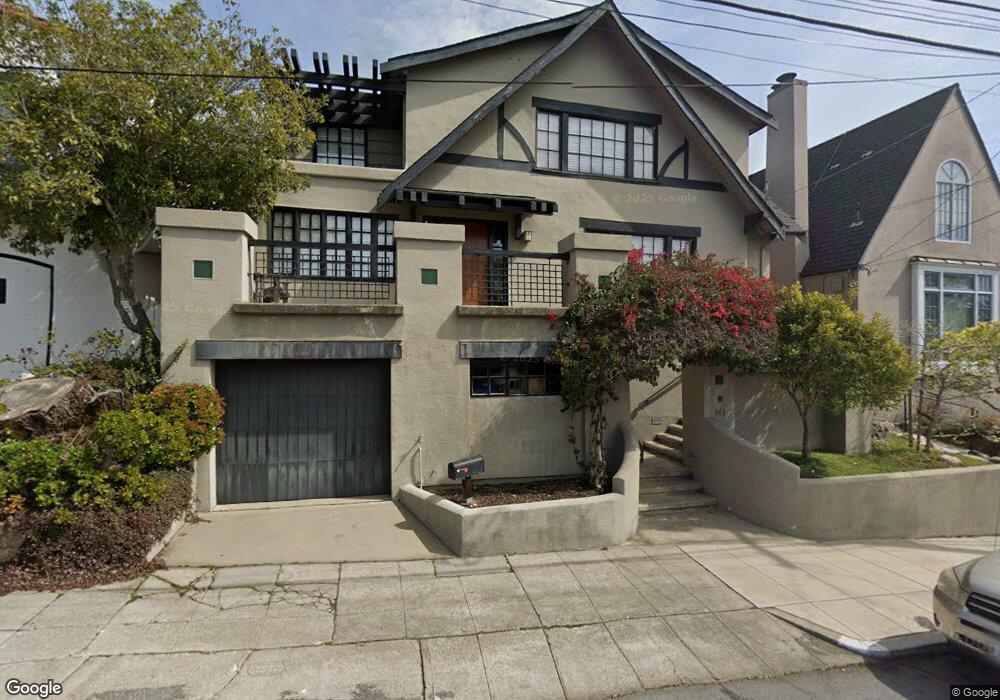
663 Vincente Ave Berkeley, CA 94707
Thousand Oaks NeighborhoodEstimated Value: $1,791,000 - $2,505,000
5
Beds
2
Baths
2,349
Sq Ft
$861/Sq Ft
Est. Value
About This Home
This home is located at 663 Vincente Ave, Berkeley, CA 94707 and is currently estimated at $2,021,685, approximately $860 per square foot. 663 Vincente Ave is a home located in Alameda County with nearby schools including Thousand Oaks Elementary School, Ruth Acty Elementary, and Berkeley Arts Magnet at Whittier School.
Ownership History
Date
Name
Owned For
Owner Type
Purchase Details
Closed on
Dec 12, 2023
Sold by
Morrill Calvin and Morrill Alisa Wabnik
Bought by
Alisa W Morrill And Calvin K Morrill Family T and Morrill
Current Estimated Value
Purchase Details
Closed on
Sep 25, 2009
Sold by
Rivera Mayra and Santiago Jose Carlos
Bought by
Morrill Calvin and Morrill Alisa Wabnik
Home Financials for this Owner
Home Financials are based on the most recent Mortgage that was taken out on this home.
Original Mortgage
$770,000
Interest Rate
5.08%
Mortgage Type
Purchase Money Mortgage
Purchase Details
Closed on
Jun 24, 2006
Sold by
Dolven Earl P and Dolven Evelyn
Bought by
Santiago Jose Carlos and Rivera Mayra
Purchase Details
Closed on
Nov 10, 2003
Sold by
Dolven Earl P and Dolven Evelyn
Bought by
Dolven Earl P and Dolven Evelyn
Create a Home Valuation Report for This Property
The Home Valuation Report is an in-depth analysis detailing your home's value as well as a comparison with similar homes in the area
Home Values in the Area
Average Home Value in this Area
Purchase History
| Date | Buyer | Sale Price | Title Company |
|---|---|---|---|
| Alisa W Morrill And Calvin K Morrill Family T | -- | None Listed On Document | |
| Morrill Calvin | $1,177,000 | Placer Title Company | |
| Santiago Jose Carlos | $1,130,000 | First American Title Co | |
| Dolven Earl P | -- | -- | |
| Dolven Earl P | -- | -- |
Source: Public Records
Mortgage History
| Date | Status | Borrower | Loan Amount |
|---|---|---|---|
| Previous Owner | Morrill Calvin | $770,000 | |
| Closed | Santiago Jose Carlos | $0 |
Source: Public Records
Tax History
| Year | Tax Paid | Tax Assessment Tax Assessment Total Assessment is a certain percentage of the fair market value that is determined by local assessors to be the total taxable value of land and additions on the property. | Land | Improvement |
|---|---|---|---|---|
| 2025 | $22,213 | $1,521,796 | $455,756 | $1,073,040 |
| 2024 | $22,213 | $1,491,830 | $446,823 | $1,052,007 |
| 2023 | $21,766 | $1,469,444 | $438,062 | $1,031,382 |
| 2022 | $21,403 | $1,433,638 | $429,475 | $1,011,163 |
| 2021 | $21,474 | $1,405,401 | $421,057 | $991,344 |
| 2020 | $20,365 | $1,397,927 | $416,742 | $981,185 |
| 2019 | $19,702 | $1,370,520 | $408,572 | $961,948 |
| 2018 | $19,391 | $1,343,656 | $400,563 | $943,093 |
| 2017 | $18,744 | $1,317,314 | $392,710 | $924,604 |
| 2016 | $18,191 | $1,291,493 | $385,013 | $906,480 |
| 2015 | $17,957 | $1,272,103 | $379,232 | $892,871 |
| 2014 | $17,062 | $1,184,000 | $355,200 | $828,800 |
Source: Public Records
Map
Nearby Homes
- 1563 Thousand Oaks Blvd
- 1983 Yosemite Rd
- 600 San Luis Rd
- 720 Key Route Blvd
- 549 Santa Barbara Rd
- 1266 Washington Ave
- 820 Key Route Blvd
- 483 Boynton Ave
- 770 Santa Barbara Rd
- 606 Masonic Ave
- 826 Indian Rock Ave
- 46 Ardmore Rd
- 938 Masonic Ave
- 417 Evelyn Ave Unit 205
- 225 Arlington Ave
- 479 Kentucky Ave
- 1038 Pomona Ave
- 1150 Washington Ave
- 1066 Peralta Ave
- 614 Cragmont Ave
- 667 Vincente Ave
- 655 Vincente Ave
- 671 Vincente Ave
- 651 Vincente Ave
- 640 Santa Rosa Ave
- 636 Santa Rosa Ave
- 642 Santa Rosa Ave
- 630 San Miguel Ave
- 660 Vincente Ave
- 646 Santa Rosa Ave
- 664 Vincente Ave
- 675 Vincente Ave
- 649 Vincente Ave
- 656 Vincente Ave
- 670 Vincente Ave
- 628 San Miguel Ave
- 650 Santa Rosa Ave
- 650 Vincente Ave
- 674 Vincente Ave
- 643 Vincente Ave
Your Personal Tour Guide
Ask me questions while you tour the home.