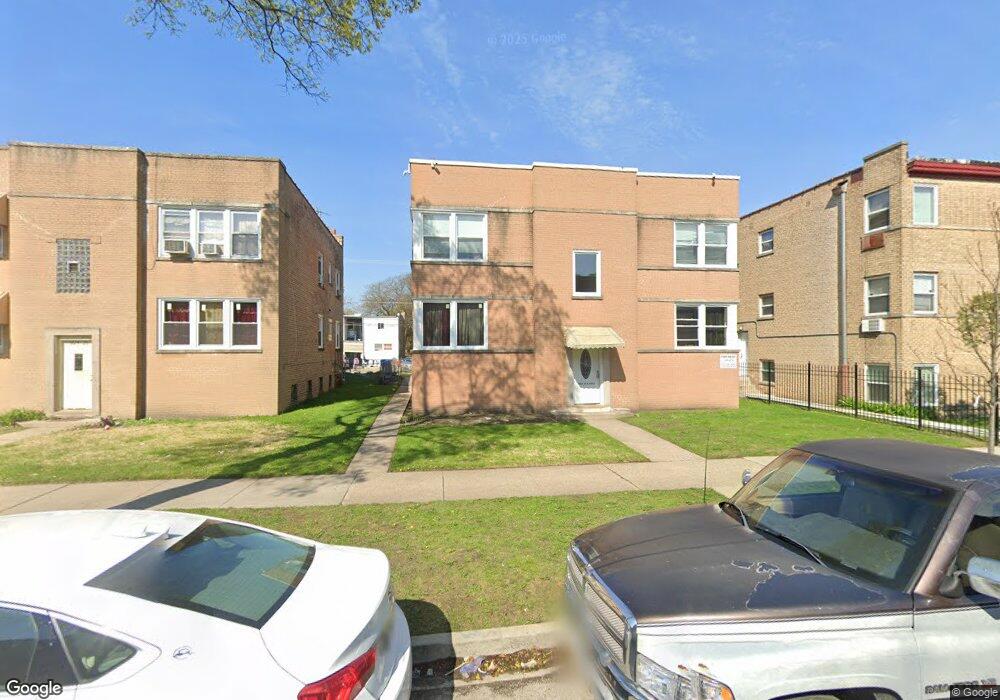
6630 N Damen Ave Unit 2S Chicago, IL 60645
West Ridge NeighborhoodEstimated Value: $184,000 - $223,000
--
Bed
--
Bath
6,492
Sq Ft
$31/Sq Ft
Est. Value
About This Home
This home is located at 6630 N Damen Ave Unit 2S, Chicago, IL 60645 and is currently estimated at $201,638, approximately $31 per square foot. 6630 N Damen Ave Unit 2S is a home located in Cook County with nearby schools including George Armstrong Elementary School, Sullivan High School, and Northside Catholic Academy.
Ownership History
Date
Name
Owned For
Owner Type
Purchase Details
Closed on
Apr 27, 2018
Sold by
Limachia Vinod and Limachia Hasumati
Bought by
Stroe Cosmin and Stroe Bogdan
Current Estimated Value
Home Financials for this Owner
Home Financials are based on the most recent Mortgage that was taken out on this home.
Original Mortgage
$108,000
Outstanding Balance
$93,976
Interest Rate
4.87%
Mortgage Type
New Conventional
Estimated Equity
$107,662
Purchase Details
Closed on
Jan 20, 1995
Sold by
Limachia Vinod
Bought by
Limachia Vinod and Limachia Hasumati
Home Financials for this Owner
Home Financials are based on the most recent Mortgage that was taken out on this home.
Original Mortgage
$52,000
Interest Rate
8.62%
Mortgage Type
Purchase Money Mortgage
Purchase Details
Closed on
Feb 1, 1994
Sold by
International Society For Krishna Consci
Bought by
Limachia Vinod
Create a Home Valuation Report for This Property
The Home Valuation Report is an in-depth analysis detailing your home's value as well as a comparison with similar homes in the area
Home Values in the Area
Average Home Value in this Area
Purchase History
| Date | Buyer | Sale Price | Title Company |
|---|---|---|---|
| Stroe Cosmin | $140,000 | Attorney | |
| Limachia Vinod | -- | -- | |
| Limachia Vinod | -- | -- | |
| Limachia Iskcon | -- | -- |
Source: Public Records
Mortgage History
| Date | Status | Borrower | Loan Amount |
|---|---|---|---|
| Open | Stroe Cosmin | $108,000 | |
| Previous Owner | Limachia Vinod | $52,000 |
Source: Public Records
Tax History Compared to Growth
Tax History
| Year | Tax Paid | Tax Assessment Tax Assessment Total Assessment is a certain percentage of the fair market value that is determined by local assessors to be the total taxable value of land and additions on the property. | Land | Improvement |
|---|---|---|---|---|
| 2024 | $3,165 | $16,371 | $3,425 | $12,946 |
| 2023 | $3,085 | $15,000 | $2,740 | $12,260 |
| 2022 | $3,085 | $15,000 | $2,740 | $12,260 |
| 2021 | $3,016 | $14,999 | $2,739 | $12,260 |
| 2020 | $2,866 | $12,864 | $2,587 | $10,277 |
| 2019 | $2,867 | $14,270 | $2,587 | $11,683 |
| 2018 | $2,140 | $14,270 | $2,587 | $11,683 |
| 2017 | $1,541 | $10,535 | $2,283 | $8,252 |
| 2016 | $2,137 | $13,169 | $2,283 | $10,886 |
| 2015 | $1,932 | $13,169 | $2,283 | $10,886 |
| 2014 | $1,564 | $11,000 | $2,054 | $8,946 |
| 2013 | $1,522 | $11,000 | $2,054 | $8,946 |
Source: Public Records
Map
Nearby Homes
- 6561 N Seeley Ave
- 1937 W Pratt Blvd Unit 2N
- 2025 W Arthur Ave Unit C2
- 2065 W Farwell Ave Unit 20653N
- 6500 N Ridge Blvd Unit 4E
- 2111 W Arthur Ave Unit 1S
- 6801 N Wolcott Ave
- 6433 N Damen Ave Unit 3E
- 6421 N Damen Ave Unit 1W
- 6414 N Hoyne Ave Unit 3W
- 2130 W Farwell Ave
- 6457 N Bell Ave Unit 2
- 6423 N Leavitt St
- 2036 W Morse Ave Unit D
- 2217 W Farwell Ave Unit 2B
- 1749 W North Shore Ave
- 1745 W North Shore Ave
- 1958 W Morse Ave Unit B
- 2245 W Farwell Ave Unit 3B
- 6959 N Ridge Blvd Unit 1C
- 6630 N Damen Ave Unit 1N
- 6630 N Damen Ave Unit 2N
- 6632 N Damen Ave
- 6634 N Damen Ave
- 6628 N Damen Ave Unit 1S
- 6638 N Damen Ave
- 6626 N Damen Ave Unit 2N
- 6626 N Damen Ave Unit 1N
- 6624 N Damen Ave Unit 1S
- 6624 N Damen Ave Unit 2S
- 6642 N Damen Ave Unit 1S
- 6644 N Damen Ave Unit 2N
- 6642 N Damen Ave Unit 2S
- 6644 N Damen Ave Unit 1N
- 6635 N Seeley Ave Unit IN
- 6635 N Seeley Ave Unit 2N
- 6618 N Damen Ave Unit 2S
- 6620 N Damen Ave Unit 2N
- 6620 N Damen Ave Unit 1N
- 6618 N Damen Ave Unit 1S