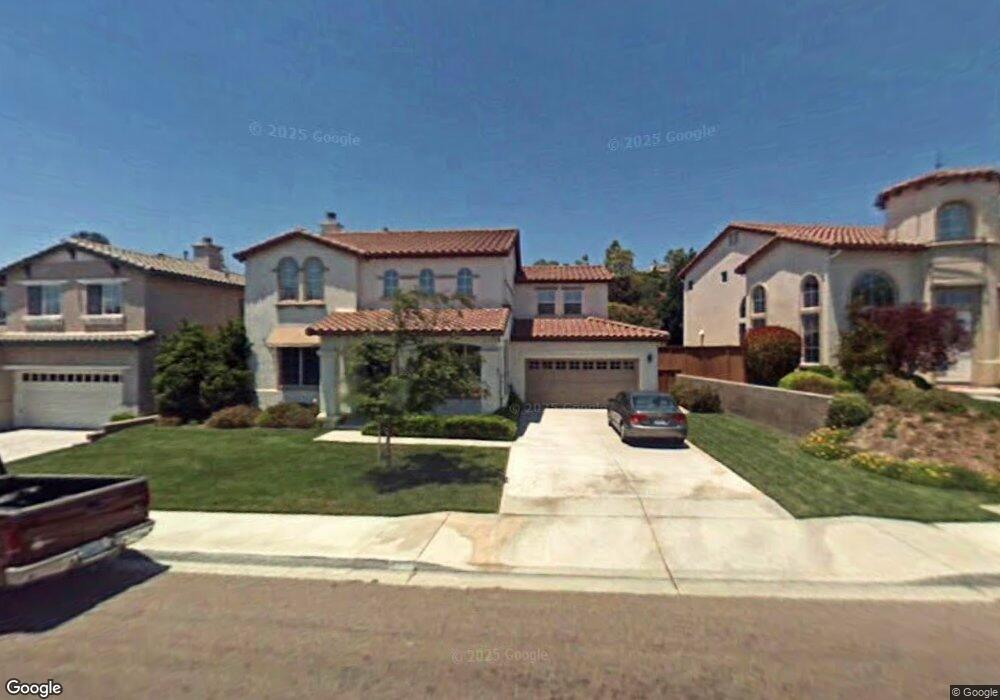
664 El Portal Dr Chula Vista, CA 91914
Rolling Hills Ranch NeighborhoodEstimated Value: $1,160,705 - $1,304,000
4
Beds
3
Baths
2,484
Sq Ft
$496/Sq Ft
Est. Value
About This Home
This home is located at 664 El Portal Dr, Chula Vista, CA 91914 and is currently estimated at $1,233,176, approximately $496 per square foot. 664 El Portal Dr is a home located in San Diego County with nearby schools including Thurgood Marshall Elementary School, Eastlake Middle School, and Eastlake High School.
Ownership History
Date
Name
Owned For
Owner Type
Purchase Details
Closed on
Dec 7, 2011
Sold by
Souza Neil W and Souza Leslie E
Bought by
Souza Neil W and Souza Leslie E
Current Estimated Value
Home Financials for this Owner
Home Financials are based on the most recent Mortgage that was taken out on this home.
Original Mortgage
$162,500
Outstanding Balance
$17,494
Interest Rate
3.94%
Mortgage Type
New Conventional
Estimated Equity
$1,215,682
Purchase Details
Closed on
Dec 28, 2010
Sold by
Souza Neil W and Souza Leslie E
Bought by
Souza Neil W and Souza Leslie E
Purchase Details
Closed on
Mar 12, 1999
Sold by
Pacific Bay Properties
Bought by
Souza Neil W and Souza Leslie E
Home Financials for this Owner
Home Financials are based on the most recent Mortgage that was taken out on this home.
Original Mortgage
$242,000
Interest Rate
3.95%
Create a Home Valuation Report for This Property
The Home Valuation Report is an in-depth analysis detailing your home's value as well as a comparison with similar homes in the area
Home Values in the Area
Average Home Value in this Area
Purchase History
| Date | Buyer | Sale Price | Title Company |
|---|---|---|---|
| Souza Neil W | -- | Fidelity National Title Co | |
| Souza Neil W | -- | Fidelity National Title Co | |
| Souza Neil W | -- | None Available | |
| Souza Neil W | $282,500 | First American Title |
Source: Public Records
Mortgage History
| Date | Status | Borrower | Loan Amount |
|---|---|---|---|
| Open | Souza Neil W | $162,500 | |
| Closed | Souza Neil W | $242,000 |
Source: Public Records
Tax History Compared to Growth
Tax History
| Year | Tax Paid | Tax Assessment Tax Assessment Total Assessment is a certain percentage of the fair market value that is determined by local assessors to be the total taxable value of land and additions on the property. | Land | Improvement |
|---|---|---|---|---|
| 2025 | $5,495 | $489,534 | $101,887 | $387,647 |
| 2024 | $5,495 | $479,937 | $99,890 | $380,047 |
| 2023 | $5,033 | $438,528 | $97,932 | $340,596 |
| 2022 | $4,892 | $429,930 | $96,012 | $333,918 |
| 2021 | $4,774 | $421,501 | $94,130 | $327,371 |
| 2020 | $4,664 | $417,180 | $93,165 | $324,015 |
| 2019 | $4,405 | $397,001 | $91,339 | $305,662 |
| 2018 | $4,333 | $389,218 | $89,549 | $299,669 |
| 2017 | $12 | $381,588 | $87,794 | $293,794 |
| 2016 | $4,134 | $374,107 | $86,073 | $288,034 |
| 2015 | $4,079 | $368,489 | $84,781 | $283,708 |
| 2014 | $4,002 | $361,272 | $83,121 | $278,151 |
Source: Public Records
Map
Nearby Homes
- 2567 View Trail Ct Unit 1
- 2706 Valleycreek Cir
- 771 Dry Creek Dr
- 544 Rocking Horse Dr
- 2532 Oak Knoll Ct
- 760 N Fox Run Place
- 728 Crooked Path Place Unit 2
- 2264 Huntington Point Rd Unit 102
- 2170 Lago Ventana
- 2401 Paseo Los Gatos
- 2917 Babbling Brook Rd
- 2946 Ranch Gate Rd
- 2890 Gate Fifteen Place
- 380 Callesita Mariola
- 986 White Alder Ave
- 2957 Ranch Gate Rd
- 2180 Hamden Dr
- 1001 White Alder Ave
- 418 Corte Calypso
- 428 Evening View Dr
- 668 El Portal Dr
- 660 El Portal Dr
- 656 El Portal Dr
- 672 El Portal Dr
- 2630 Santa Maria Ct
- 2634 Santa Maria Ct Unit 4
- 652 El Portal Dr
- 2626 Santa Maria Ct
- 676 El Portal Dr
- 665 El Portal Dr
- 669 El Portal Dr
- 2638 Santa Maria Ct
- 2627 El Granada Rd
- 673 El Portal Dr
- 2622 Santa Maria Ct
- 644 El Portal Dr
- 680 El Portal Dr
- 677 El Portal Dr
- 661 El Portal Dr
- 2631 El Granada Rd