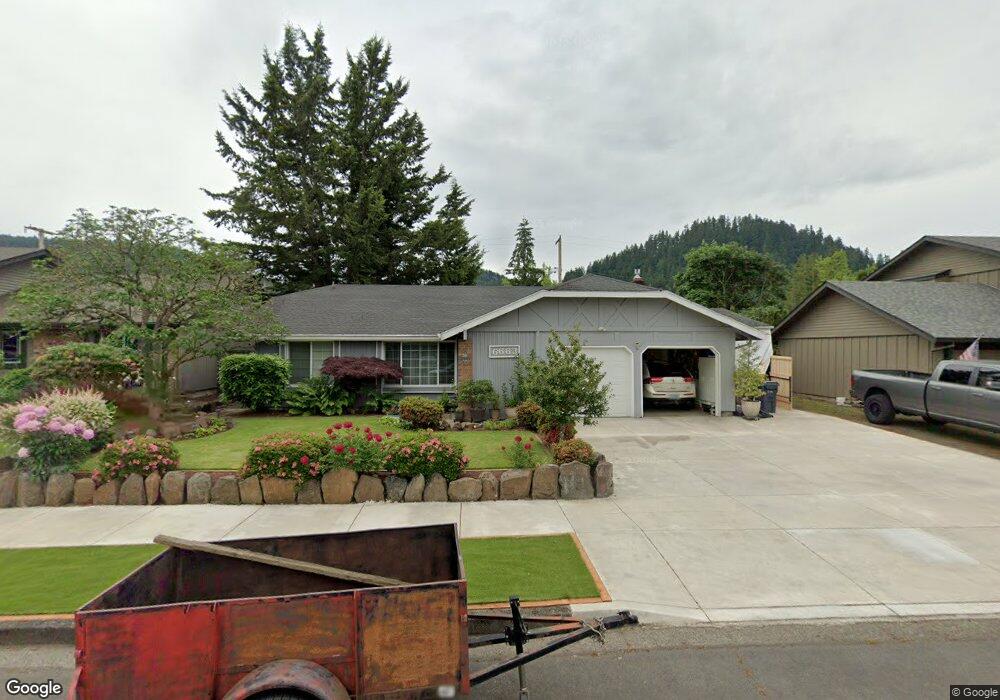
6663 B St Springfield, OR 97478
Thurston NeighborhoodEstimated Value: $441,729 - $487,000
3
Beds
2
Baths
1,630
Sq Ft
$284/Sq Ft
Est. Value
About This Home
This home is located at 6663 B St, Springfield, OR 97478 and is currently estimated at $462,182, approximately $283 per square foot. 6663 B St is a home located in Lane County with nearby schools including Ridgeview Elementary School, Thurston Middle School, and Thurston High School.
Ownership History
Date
Name
Owned For
Owner Type
Purchase Details
Closed on
Oct 14, 1998
Sold by
Itami Jack F
Bought by
Itami Jack F and Itami Karen D
Current Estimated Value
Home Financials for this Owner
Home Financials are based on the most recent Mortgage that was taken out on this home.
Original Mortgage
$86,300
Interest Rate
6.79%
Purchase Details
Closed on
Mar 27, 1998
Sold by
Itami Jack
Bought by
Hellers Karen Darlene
Home Financials for this Owner
Home Financials are based on the most recent Mortgage that was taken out on this home.
Original Mortgage
$100,000
Interest Rate
8%
Mortgage Type
Seller Take Back
Create a Home Valuation Report for This Property
The Home Valuation Report is an in-depth analysis detailing your home's value as well as a comparison with similar homes in the area
Home Values in the Area
Average Home Value in this Area
Purchase History
| Date | Buyer | Sale Price | Title Company |
|---|---|---|---|
| Itami Jack F | -- | Title Guaranty Company | |
| Hellers Karen Darlene | $120,000 | -- |
Source: Public Records
Mortgage History
| Date | Status | Borrower | Loan Amount |
|---|---|---|---|
| Closed | Itami Jack F | $86,300 | |
| Closed | Hellers Karen Darlene | $100,000 |
Source: Public Records
Tax History
| Year | Tax Paid | Tax Assessment Tax Assessment Total Assessment is a certain percentage of the fair market value that is determined by local assessors to be the total taxable value of land and additions on the property. | Land | Improvement |
|---|---|---|---|---|
| 2025 | $4,262 | $232,394 | -- | -- |
| 2024 | $4,193 | $225,626 | -- | -- |
| 2023 | $4,193 | $219,055 | $0 | $0 |
| 2022 | $3,883 | $212,675 | $0 | $0 |
| 2021 | $3,813 | $206,481 | $0 | $0 |
| 2020 | $3,702 | $200,467 | $0 | $0 |
| 2019 | $3,591 | $194,629 | $0 | $0 |
| 2018 | $3,385 | $183,457 | $0 | $0 |
| 2017 | $3,255 | $183,457 | $0 | $0 |
| 2016 | $3,186 | $178,114 | $0 | $0 |
| 2015 | $3,095 | $172,926 | $0 | $0 |
| 2014 | $3,049 | $167,889 | $0 | $0 |
Source: Public Records
Map
Nearby Homes
- 250 68th St
- 6875 B St
- 6540 B St
- 555 66th St
- 6445 B St
- 6451 Dogwood St
- 6964 Bluebelle Way
- 246 S 70th St
- 320 Mountaingate Dr
- 6884 Forest Ridge Dr
- 0 Forest Ridge Unit 520732026
- 353 71st St
- 193 62nd Place
- 0 71st St
- 0 Forest Ridge Dr Unit 637211360
- 0 S 69th Place
- 6898 Thurston Rd
- 6225 Forest Ridge Dr
- 7027 S E St
- 616 S 71st St
Your Personal Tour Guide
Ask me questions while you tour the home.