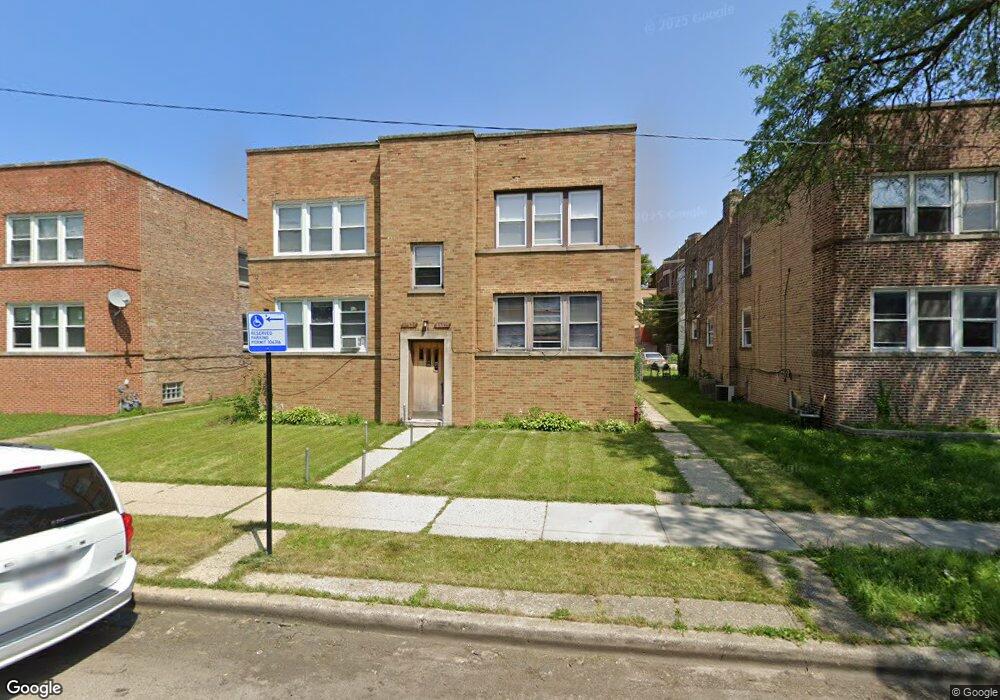
6663 N Seeley Ave Unit 2N Chicago, IL 60645
West Ridge NeighborhoodEstimated Value: $128,000 - $198,000
2
Beds
1
Bath
6,150
Sq Ft
$25/Sq Ft
Est. Value
About This Home
This home is located at 6663 N Seeley Ave Unit 2N, Chicago, IL 60645 and is currently estimated at $155,493, approximately $25 per square foot. 6663 N Seeley Ave Unit 2N is a home located in Cook County with nearby schools including George Armstrong Elementary School, Sullivan High School, and God's Battle Axe Prayer Academy.
Ownership History
Date
Name
Owned For
Owner Type
Purchase Details
Closed on
Oct 17, 2008
Sold by
Us Bank Na
Bought by
Haji Makbul A
Current Estimated Value
Purchase Details
Closed on
Sep 4, 2008
Sold by
Funes Saul O and Funes Saul Omar
Bought by
Us Bank Na and Series #2005Efc4 Pool #40166
Purchase Details
Closed on
Jul 20, 2005
Sold by
Chaudhry Tahir and Chaudhry Fatima
Bought by
Funes Saul O
Home Financials for this Owner
Home Financials are based on the most recent Mortgage that was taken out on this home.
Original Mortgage
$34,600
Interest Rate
5.66%
Mortgage Type
Stand Alone Second
Purchase Details
Closed on
Jun 2, 1998
Sold by
Parikh Parag S and Parikh Sejal P
Bought by
Chaudhry Tahir and Chaudhry Fatima
Home Financials for this Owner
Home Financials are based on the most recent Mortgage that was taken out on this home.
Original Mortgage
$67,900
Interest Rate
7.27%
Create a Home Valuation Report for This Property
The Home Valuation Report is an in-depth analysis detailing your home's value as well as a comparison with similar homes in the area
Home Values in the Area
Average Home Value in this Area
Purchase History
| Date | Buyer | Sale Price | Title Company |
|---|---|---|---|
| Haji Makbul A | $80,000 | First American Title | |
| Us Bank Na | -- | None Available | |
| Funes Saul O | $173,000 | First American Title | |
| Chaudhry Tahir | $71,500 | -- |
Source: Public Records
Mortgage History
| Date | Status | Borrower | Loan Amount |
|---|---|---|---|
| Previous Owner | Funes Saul O | $34,600 | |
| Previous Owner | Chaudhry Tahir | $67,900 |
Source: Public Records
Tax History Compared to Growth
Tax History
| Year | Tax Paid | Tax Assessment Tax Assessment Total Assessment is a certain percentage of the fair market value that is determined by local assessors to be the total taxable value of land and additions on the property. | Land | Improvement |
|---|---|---|---|---|
| 2024 | $1,688 | $14,940 | $3,534 | $11,406 |
| 2023 | $1,645 | $8,000 | $2,827 | $5,173 |
| 2022 | $1,645 | $8,000 | $2,827 | $5,173 |
| 2021 | $1,609 | $7,999 | $2,827 | $5,172 |
| 2020 | $2,178 | $9,776 | $2,670 | $7,106 |
| 2019 | $2,179 | $10,845 | $2,670 | $8,175 |
| 2018 | $2,255 | $11,415 | $2,670 | $8,745 |
| 2017 | $1,848 | $8,585 | $2,356 | $6,229 |
| 2016 | $1,988 | $9,925 | $2,356 | $7,569 |
| 2015 | $1,914 | $10,447 | $2,356 | $8,091 |
| 2014 | $1,241 | $6,687 | $2,120 | $4,567 |
| 2013 | $1,280 | $7,039 | $2,120 | $4,919 |
Source: Public Records
Map
Nearby Homes
- 6561 N Seeley Ave
- 1937 W Pratt Blvd Unit 2N
- 2025 W Arthur Ave Unit C2
- 2065 W Farwell Ave Unit 20653N
- 6500 N Ridge Blvd Unit 4E
- 2111 W Arthur Ave Unit 1S
- 6801 N Wolcott Ave
- 6433 N Damen Ave Unit 3E
- 6421 N Damen Ave Unit 1W
- 6414 N Hoyne Ave Unit 3W
- 2130 W Farwell Ave
- 6457 N Bell Ave Unit 2
- 6423 N Leavitt St
- 2036 W Morse Ave Unit D
- 2217 W Farwell Ave Unit 2B
- 1749 W North Shore Ave
- 1745 W North Shore Ave
- 1958 W Morse Ave Unit B
- 2245 W Farwell Ave Unit 3B
- 6959 N Ridge Blvd Unit 1C
- 6661 N Seeley Ave Unit 2S
- 6661 N Seeley Ave Unit 1N
- 6661 N Seeley Ave Unit 1S
- 6703 N Seeley Ave Unit 1S
- 6703 N Seeley Ave Unit 2S
- 6659 N Seeley Ave Unit 1N
- 6659 N Seeley Ave Unit 1S
- 6659 N Seeley Ave Unit 2N
- 6705 N Seeley Ave Unit 2N
- 6705 N Seeley Ave Unit 1N
- 6705 N Seeley Ave Unit 2N
- 6657 N Seeley Ave Unit 2S
- 6657 N Seeley Ave Unit 1S
- 6707 N Seeley Ave Unit 2S
- 6707 N Seeley Ave Unit 1S
- 6709 N Seeley Ave Unit 1N
- 6709 N Seeley Ave Unit 2N
- 6655 N Seeley Ave Unit 2N
- 6655 N Seeley Ave Unit 1N
- 6653 N Seeley Ave Unit 1S