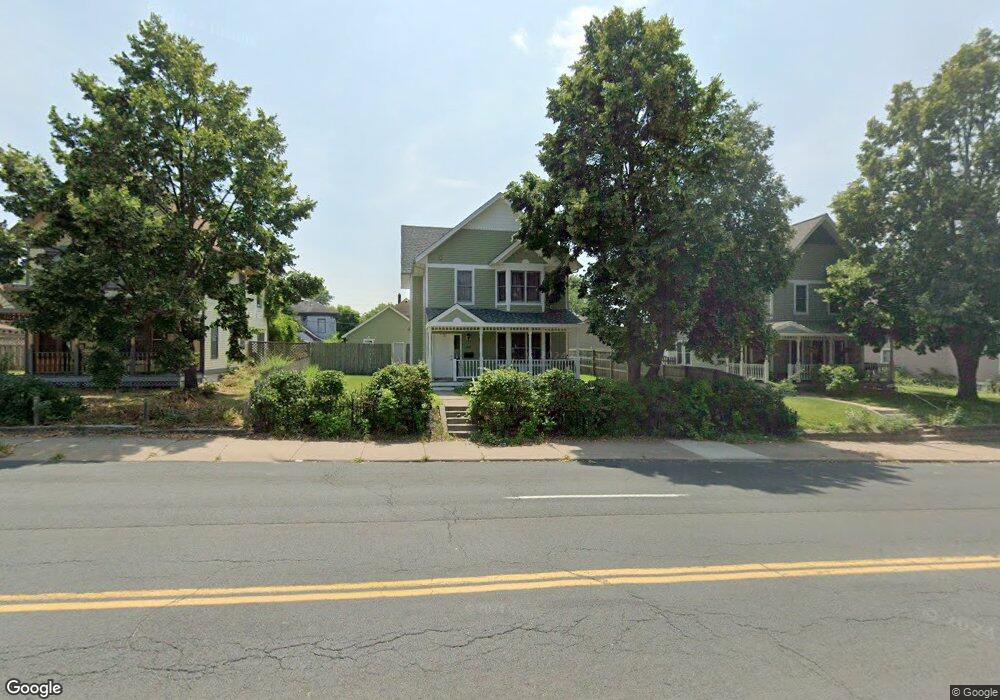
668 3rd St E Saint Paul, MN 55106
Dayton's Bluff NeighborhoodEstimated Value: $255,000 - $277,000
3
Beds
2
Baths
1,116
Sq Ft
$238/Sq Ft
Est. Value
About This Home
This home is located at 668 3rd St E, Saint Paul, MN 55106 and is currently estimated at $266,014, approximately $238 per square foot. 668 3rd St E is a home located in Ramsey County with nearby schools including Dayton's Bluff Achievement Plus Elementary School, Battle Creek Middle School, and Harding Senior High School.
Ownership History
Date
Name
Owned For
Owner Type
Purchase Details
Closed on
Jun 4, 2008
Sold by
Hsbc Bank Usa
Bought by
Thao Vue and Lor Nina
Current Estimated Value
Purchase Details
Closed on
May 16, 2006
Sold by
Vang May and Vang Wa Ying
Bought by
Xiong Lucy
Purchase Details
Closed on
Dec 17, 2004
Sold by
Vang Mai Yia
Bought by
Vang May and Vang Waying
Purchase Details
Closed on
Oct 9, 2001
Sold by
Yang Sang and Her Pang Nhia
Bought by
Yang Vang and Vang Mai Yia
Purchase Details
Closed on
Aug 27, 1999
Sold by
Viggiano Penelope L and Viggiano Francis X
Bought by
Yang Sang and Her Pang Nhia
Purchase Details
Closed on
Jun 12, 1996
Sold by
Wierzbicki Tim S
Bought by
Viggiano Francis X
Create a Home Valuation Report for This Property
The Home Valuation Report is an in-depth analysis detailing your home's value as well as a comparison with similar homes in the area
Home Values in the Area
Average Home Value in this Area
Purchase History
| Date | Buyer | Sale Price | Title Company |
|---|---|---|---|
| Thao Vue | $121,000 | -- | |
| Xiong Lucy | $260,000 | -- | |
| Vang May | $235,000 | -- | |
| Yang Vang | $139,000 | -- | |
| Yang Sang | $100,000 | -- | |
| Viggiano Francis X | $82,900 | -- |
Source: Public Records
Tax History
| Year | Tax Paid | Tax Assessment Tax Assessment Total Assessment is a certain percentage of the fair market value that is determined by local assessors to be the total taxable value of land and additions on the property. | Land | Improvement |
|---|---|---|---|---|
| 2025 | $4,180 | $295,900 | $25,000 | $270,900 |
| 2023 | $4,180 | $277,500 | $13,000 | $264,500 |
| 2022 | $3,788 | $274,300 | $13,000 | $261,300 |
| 2021 | $3,180 | $245,000 | $13,000 | $232,000 |
| 2020 | $3,154 | $204,300 | $13,000 | $191,300 |
| 2019 | $2,914 | $191,700 | $13,000 | $178,700 |
| 2018 | $2,916 | $186,400 | $13,000 | $173,400 |
| 2017 | $2,366 | $188,500 | $13,000 | $175,500 |
| 2016 | $2,144 | $0 | $0 | $0 |
| 2015 | $2,400 | $148,800 | $11,000 | $137,800 |
| 2014 | $2,666 | $0 | $0 | $0 |
Source: Public Records
Map
Nearby Homes
Your Personal Tour Guide
Ask me questions while you tour the home.