Estimated Value: $337,191 - $390,000
3
Beds
1
Bath
1,542
Sq Ft
$237/Sq Ft
Est. Value
About This Home
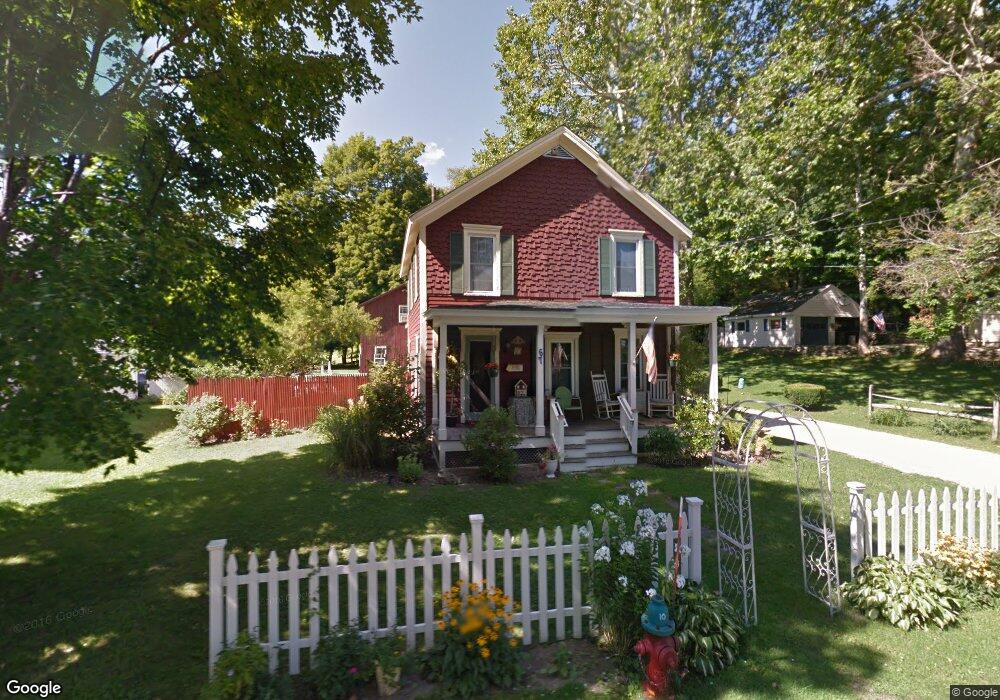
This home is located at 67 E Center St, Lee, MA 01238 and is currently estimated at $366,048, approximately $237 per square foot. 67 E Center St is a home located in Berkshire County with nearby schools including Lee Elementary School, Lee Middle/High School, and St. Mary's School.
Ownership History
Date
Name
Owned For
Owner Type
Purchase Details
Closed on
Jan 27, 1997
Sold by
Blache Gerard J and Blache Colleen M
Bought by
Hayden Christopher T and Lavigne Michelle L
Current Estimated Value
Home Financials for this Owner
Home Financials are based on the most recent Mortgage that was taken out on this home.
Original Mortgage
$104,500
Interest Rate
7.5%
Mortgage Type
Purchase Money Mortgage
Purchase Details
Closed on
Dec 16, 1991
Sold by
Brown Rose M
Bought by
Blache Gerard J and Blache Colleen M
Create a Home Valuation Report for This Property
The Home Valuation Report is an in-depth analysis detailing your home's value as well as a comparison with similar homes in the area
Home Values in the Area
Average Home Value in this Area
Purchase History
| Date | Buyer | Sale Price | Title Company |
|---|---|---|---|
| Hayden Christopher T | $110,000 | -- | |
| Blache Gerard J | $98,000 | -- |
Source: Public Records
Mortgage History
| Date | Status | Borrower | Loan Amount |
|---|---|---|---|
| Open | Blache Gerard J | $9,750 | |
| Open | Blache Gerard J | $104,000 | |
| Closed | Blache Gerard J | $104,500 | |
| Previous Owner | Blache Gerard J | $73,500 |
Source: Public Records
Tax History
| Year | Tax Paid | Tax Assessment Tax Assessment Total Assessment is a certain percentage of the fair market value that is determined by local assessors to be the total taxable value of land and additions on the property. | Land | Improvement |
|---|---|---|---|---|
| 2025 | $3,101 | $275,600 | $77,700 | $197,900 |
| 2024 | $3,245 | $288,700 | $76,200 | $212,500 |
| 2023 | $3,110 | $262,900 | $72,500 | $190,400 |
| 2022 | $2,868 | $210,100 | $62,700 | $147,400 |
| 2021 | $3,215 | $219,000 | $86,200 | $132,800 |
| 2020 | $3,137 | $213,700 | $80,400 | $133,300 |
| 2019 | $3,240 | $219,200 | $82,400 | $136,800 |
| 2018 | $3,189 | $218,000 | $82,400 | $135,600 |
| 2017 | $3,068 | $208,400 | $70,300 | $138,100 |
| 2016 | $3,005 | $206,400 | $68,300 | $138,100 |
| 2015 | $2,906 | $206,400 | $68,300 | $138,100 |
| 2014 | $2,848 | $201,300 | $68,300 | $133,000 |
Source: Public Records
Map
Nearby Homes
- 180 Center St
- 30 Pease Terrace
- 205 High St
- 131 Center St
- 290 E Center St
- 0 East St Unit 235893
- 155 Laurel St
- 135 East St
- 140 Theresa Terrace
- 155 Water St Unit 5
- 2 Devon Rd
- 184 Washington Mountain Rd
- 615 Laurel St
- 528 Walker St
- 524 Walker St
- 500 Walker St
- 45 Forest St
- 735 Cape St
- 2 Saint Andrews Ct
- 770 Summer St Unit 5D
- 63 E Center St
- 0 E Center St
- 81 E Center St
- 55 E Center St
- 80 E Center St
- 64 E Center St
- 53 E Center St
- 49 E Center St
- 56 E Center St
- 95 E Center St
- 50 E Center St
- 87 E Center St
- 51 E Center St
- 94 E Center St
- 42 E Center St
- 37 E Center St
- 86 E Center St
- 36 E Center St
- 106 E Center St
- 105 E Center St
Your Personal Tour Guide
Ask me questions while you tour the home.