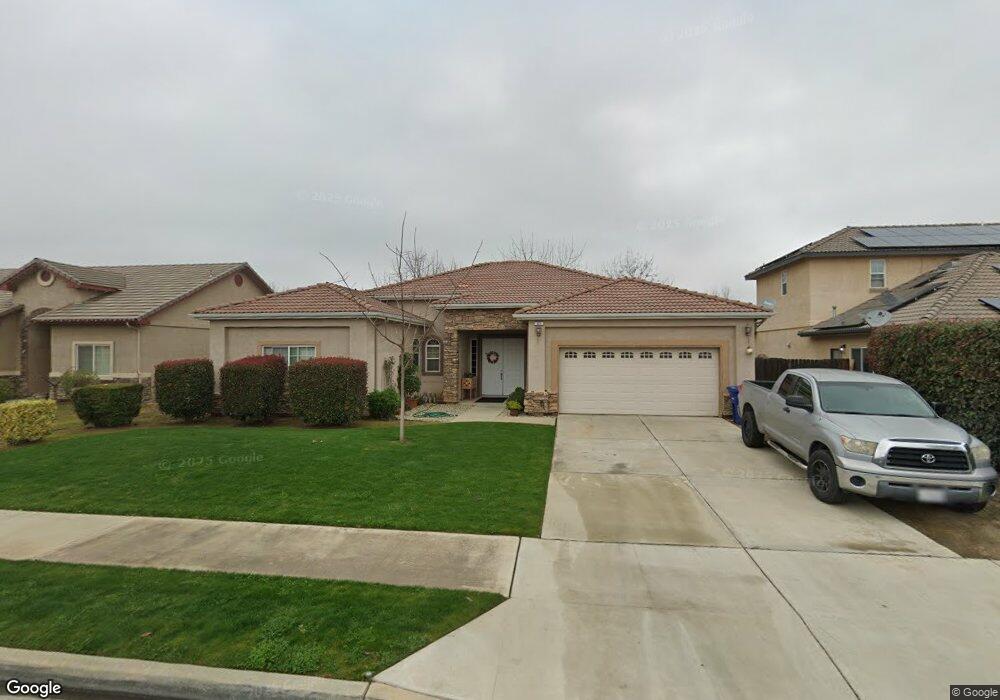
67 N Dalton Ave Sanger, CA 93657
Estimated Value: $443,217 - $559,000
3
Beds
4
Baths
2,070
Sq Ft
$244/Sq Ft
Est. Value
About This Home
This home is located at 67 N Dalton Ave, Sanger, CA 93657 and is currently estimated at $504,072, approximately $243 per square foot. 67 N Dalton Ave is a home located in Fresno County with nearby schools including Reagan Elementary School, Washington Academic Middle School, and Sanger High School.
Ownership History
Date
Name
Owned For
Owner Type
Purchase Details
Closed on
Apr 8, 2016
Sold by
Helm Mark Steven and Helm Julie Delynn
Bought by
Fam Mark Steven Helm and Fam Julie Delynn Helm
Current Estimated Value
Home Financials for this Owner
Home Financials are based on the most recent Mortgage that was taken out on this home.
Original Mortgage
$164,650
Outstanding Balance
$27,940
Interest Rate
3.64%
Mortgage Type
New Conventional
Estimated Equity
$476,132
Purchase Details
Closed on
May 4, 2011
Sold by
Helm Mark S and Helm Julie D
Bought by
Helm Mark Steven and Helm Julie Delynn
Purchase Details
Closed on
Jul 16, 2005
Sold by
Sanger Ii Ca Llc
Bought by
Helm Mark S and Helm Julie D
Home Financials for this Owner
Home Financials are based on the most recent Mortgage that was taken out on this home.
Original Mortgage
$247,700
Interest Rate
5.51%
Mortgage Type
Fannie Mae Freddie Mac
Create a Home Valuation Report for This Property
The Home Valuation Report is an in-depth analysis detailing your home's value as well as a comparison with similar homes in the area
Home Values in the Area
Average Home Value in this Area
Purchase History
| Date | Buyer | Sale Price | Title Company |
|---|---|---|---|
| Fam Mark Steven Helm | -- | Tsi Title Cerritos | |
| Helm Mark Steven | -- | Tsi Title Cerritos | |
| Helm Mark Steven | -- | None Available | |
| Helm Mark S | $310,000 | Chicago Title Company |
Source: Public Records
Mortgage History
| Date | Status | Borrower | Loan Amount |
|---|---|---|---|
| Open | Helm Mark Steven | $164,650 | |
| Closed | Helm Mark S | $247,700 |
Source: Public Records
Tax History
| Year | Tax Paid | Tax Assessment Tax Assessment Total Assessment is a certain percentage of the fair market value that is determined by local assessors to be the total taxable value of land and additions on the property. | Land | Improvement |
|---|---|---|---|---|
| 2025 | $6,174 | $422,940 | $122,984 | $299,956 |
| 2023 | $5,546 | $386,800 | $83,200 | $303,600 |
| 2022 | $5,286 | $372,000 | $80,000 | $292,000 |
| 2021 | $4,042 | $267,700 | $48,100 | $219,600 |
| 2020 | $3,885 | $265,100 | $47,700 | $217,400 |
| 2019 | $3,821 | $260,000 | $46,800 | $213,200 |
| 2018 | $3,705 | $255,000 | $45,900 | $209,100 |
| 2017 | $3,636 | $250,000 | $45,000 | $205,000 |
| 2016 | $3,453 | $245,000 | $40,000 | $205,000 |
| 2015 | $3,048 | $204,700 | $59,400 | $145,300 |
| 2014 | $2,896 | $191,800 | $55,700 | $136,100 |
Source: Public Records
Map
Nearby Homes
- 2563 Langport Ave Unit BH 33
- 2702 Holt Ave
- 2868 Casty Ct
- 169 Rosewood Ave
- 285 Claremont Ave
- 45 Lyon Ave
- 372 Lily Ave
- 238 Fairbanks Ave
- 371 Bethel Ave Unit 74
- 371 Bethel Ave Unit 24
- 371 Bethel Ave Unit 59
- 371 Bethel Ave
- 371 Bethel Ave Unit 99
- 371 Bethel Ave Unit 102
- 371 Bethel Ave Unit 62
- 371 Bethel Ave Unit 55
- 371 Bethel Ave Unit 88
- 2160 3rd St
- 2121 5th St
- 2986 Mary Ave
- 51 N Dalton Ave
- 83 N Dalton Ave
- 35 N Dalton Ave
- 2855 Atchison Ave
- 2876 Atchison Ave
- 2852 Geary Ave
- 21 N Dalton Ave
- 2864 Atchison Ave
- 2836 Geary Ave
- 2835 Atchison Ave
- 2846 Atchison Ave
- 2857 Geary Ave
- 2871 Geary Ave
- 2818 Geary Ave
- 2830 Atchison Ave
- 2817 Atchison Ave
- 2825 Geary Ave
- 2802 Geary Ave
- 2795 Atchison Ave
- 2856 Florence Ave
Your Personal Tour Guide
Ask me questions while you tour the home.