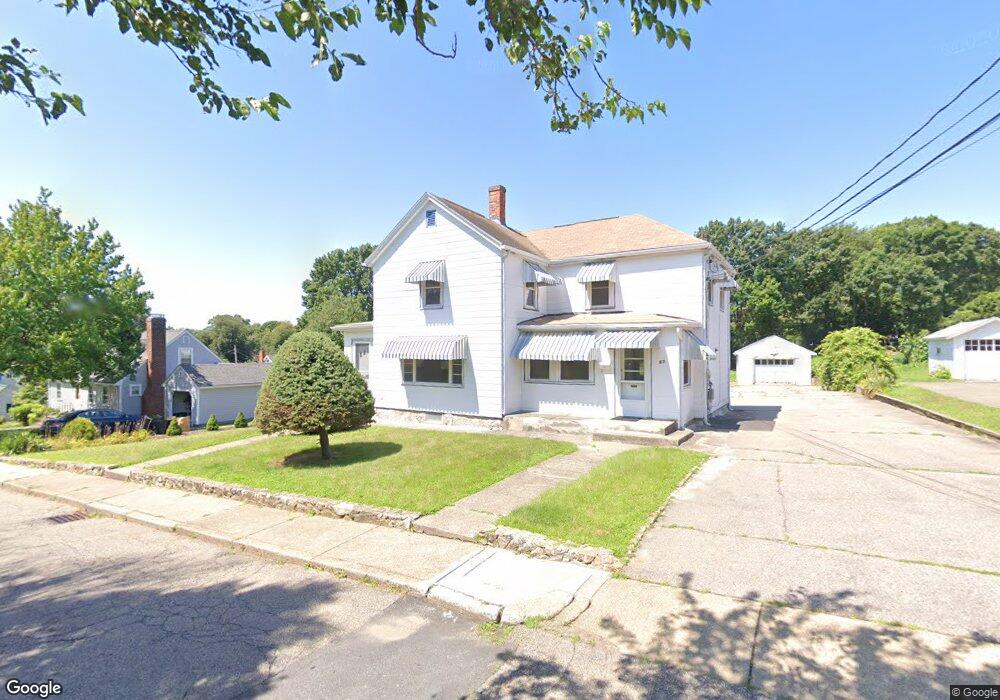
67 Sheridan St West Newton, MA 02465
West Newton NeighborhoodEstimated Value: $1,195,000 - $1,475,879
3
Beds
3
Baths
1,600
Sq Ft
$816/Sq Ft
Est. Value
About This Home
This home is located at 67 Sheridan St, West Newton, MA 02465 and is currently estimated at $1,305,220, approximately $815 per square foot. 67 Sheridan St is a home located in Middlesex County with nearby schools including Franklin Elementary School, C.C. Burr, and F.A. Day Middle School.
Ownership History
Date
Name
Owned For
Owner Type
Purchase Details
Closed on
Sep 2, 2014
Sold by
Est Caruso Giuseppe and Caruso Joanne
Bought by
Guiseppe Caruso Ret and Caruso Joanne
Current Estimated Value
Purchase Details
Closed on
Sep 5, 2006
Sold by
Caruso Concetta and Caruso Giuseppe
Bought by
Caruso Giuseppe
Purchase Details
Closed on
Jun 14, 1999
Sold by
Marrazzo Salvatore G
Bought by
Caruso Giuseppe and Caruso Concetta
Purchase Details
Closed on
Feb 27, 1995
Sold by
Marrazzo Salvatore G
Bought by
Caruso Concetta and Caruso Joanne
Create a Home Valuation Report for This Property
The Home Valuation Report is an in-depth analysis detailing your home's value as well as a comparison with similar homes in the area
Home Values in the Area
Average Home Value in this Area
Purchase History
| Date | Buyer | Sale Price | Title Company |
|---|---|---|---|
| Guiseppe Caruso Ret | -- | -- | |
| Caruso Giuseppe | -- | -- | |
| Caruso Giuseppe | $318,000 | -- | |
| Caruso Concetta | $25,000 | -- |
Source: Public Records
Mortgage History
| Date | Status | Borrower | Loan Amount |
|---|---|---|---|
| Previous Owner | Caruso Concetta | $32,000 | |
| Previous Owner | Caruso Concetta | $13,000 |
Source: Public Records
Tax History Compared to Growth
Tax History
| Year | Tax Paid | Tax Assessment Tax Assessment Total Assessment is a certain percentage of the fair market value that is determined by local assessors to be the total taxable value of land and additions on the property. | Land | Improvement |
|---|---|---|---|---|
| 2025 | $9,485 | $967,900 | $920,200 | $47,700 |
| 2024 | $9,171 | $939,700 | $893,400 | $46,300 |
| 2023 | $8,666 | $851,300 | $693,100 | $158,200 |
| 2022 | $8,292 | $788,200 | $641,800 | $146,400 |
| 2021 | $8,001 | $743,600 | $605,500 | $138,100 |
| 2020 | $7,763 | $743,600 | $605,500 | $138,100 |
| 2019 | $7,544 | $721,900 | $587,900 | $134,000 |
| 2018 | $7,166 | $662,300 | $528,500 | $133,800 |
| 2017 | $6,948 | $624,800 | $498,600 | $126,200 |
| 2016 | $6,645 | $583,900 | $466,000 | $117,900 |
| 2015 | $6,336 | $545,700 | $435,500 | $110,200 |
Source: Public Records
Map
Nearby Homes
- 56 Dearborn St
- 265-267 River St Unit 267
- 265-267 River St Unit 265
- 44 Westland Ave
- 33 Lill Ave
- 334 River St
- 14 Cottage Place Unit 14
- 287 Cherry St Unit 2
- 101-103 Lexington St
- 90 Auburndale Ave
- 24 Tolman St Unit A
- 106 River St Unit 18
- 106 River St Unit 2
- 106 River St Unit 14
- 2 Elm St Unit 6
- 2 Elm St Unit 8
- 41 Kilburn Rd
- 25 Tolman St Unit 2
- 31-37 Washington Ave
- 371 Cherry St