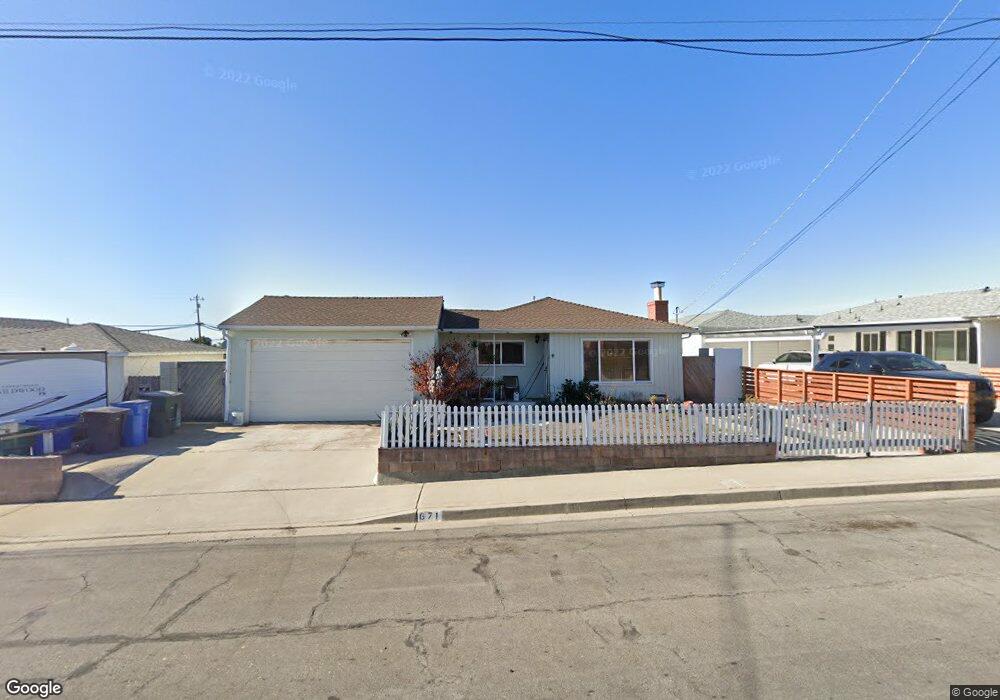
671 Del Sol St Arroyo Grande, CA 93420
Estimated Value: $703,000 - $869,000
3
Beds
2
Baths
1,297
Sq Ft
$595/Sq Ft
Est. Value
About This Home
This home is located at 671 Del Sol St, Arroyo Grande, CA 93420 and is currently estimated at $771,210, approximately $594 per square foot. 671 Del Sol St is a home located in San Luis Obispo County with nearby schools including Fairgrove Elementary School, Paulding Middle School, and Arroyo Grande High School.
Ownership History
Date
Name
Owned For
Owner Type
Purchase Details
Closed on
Apr 18, 2016
Sold by
Anacleto Frances M and Miranda Frank J
Bought by
Anacleto Ernest R and Anacleto Frances M
Current Estimated Value
Purchase Details
Closed on
Dec 2, 1993
Sold by
Hopson John O and Hopson Linda L
Bought by
Miranda Frances M and Miranda Frank J
Home Financials for this Owner
Home Financials are based on the most recent Mortgage that was taken out on this home.
Original Mortgage
$107,500
Interest Rate
7.29%
Create a Home Valuation Report for This Property
The Home Valuation Report is an in-depth analysis detailing your home's value as well as a comparison with similar homes in the area
Home Values in the Area
Average Home Value in this Area
Purchase History
| Date | Buyer | Sale Price | Title Company |
|---|---|---|---|
| Anacleto Ernest R | -- | None Available | |
| Miranda Frances M | $127,500 | Ticor Title Insurance Compan |
Source: Public Records
Mortgage History
| Date | Status | Borrower | Loan Amount |
|---|---|---|---|
| Closed | Miranda Frances M | $107,500 |
Source: Public Records
Tax History Compared to Growth
Tax History
| Year | Tax Paid | Tax Assessment Tax Assessment Total Assessment is a certain percentage of the fair market value that is determined by local assessors to be the total taxable value of land and additions on the property. | Land | Improvement |
|---|---|---|---|---|
| 2025 | $2,167 | $216,667 | $152,950 | $63,717 |
| 2024 | $2,141 | $212,419 | $149,951 | $62,468 |
| 2023 | $2,141 | $208,255 | $147,011 | $61,244 |
| 2022 | $2,107 | $204,173 | $144,129 | $60,044 |
| 2021 | $2,102 | $200,170 | $141,303 | $58,867 |
| 2020 | $2,077 | $198,119 | $139,855 | $58,264 |
| 2019 | $2,060 | $194,235 | $137,113 | $57,122 |
| 2018 | $2,034 | $190,427 | $134,425 | $56,002 |
| 2017 | $1,999 | $186,694 | $131,790 | $54,904 |
| 2016 | $1,887 | $183,034 | $129,206 | $53,828 |
| 2015 | $1,870 | $180,286 | $127,266 | $53,020 |
| 2014 | $1,801 | $176,756 | $124,774 | $51,982 |
Source: Public Records
Map
Nearby Homes
- 1241 Farroll Ave Unit 58
- 575 Carmella Dr
- 1449 Ronald Way
- 1515 Nabal Ct
- 2201 La Verne St
- 425 Bakeman Ln
- 1555 Nabal Ct
- 1172 Pacific Pointe Way
- 1162 Brittany Ave
- 1059 Rogers Ct
- 1154 Marseille Ct
- 155 Lynne St
- 1700 22nd St
- 1626 Monterey Ave
- 1207 Capitola St
- 2130 Ocean St
- 2120 Ocean St
- 1206 Capitola St
- 450 Pecan St
- 2531 Cienaga St Unit 3