Estimated Value: $699,000 - $753,000
5
Beds
4
Baths
4,048
Sq Ft
$179/Sq Ft
Est. Value
About This Home
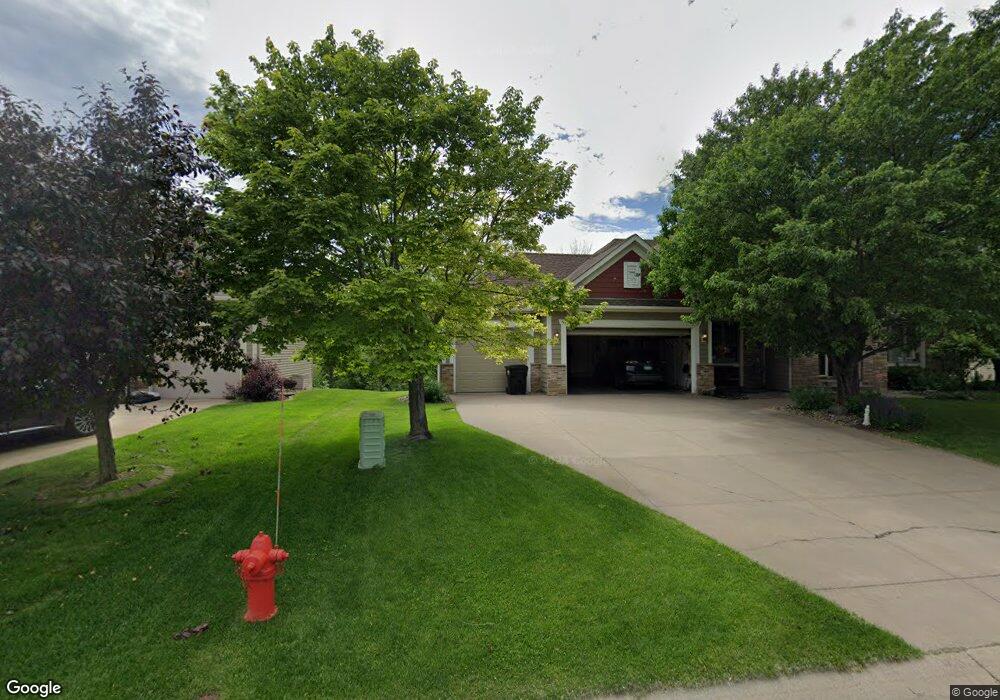
This home is located at 6719 Teal Ct, Hugo, MN 55038 and is currently estimated at $723,901, approximately $178 per square foot. 6719 Teal Ct is a home located in Anoka County with nearby schools including Centerville Elementary School, Centennial Middle School, and Centennial High School.
Ownership History
Date
Name
Owned For
Owner Type
Purchase Details
Closed on
Nov 7, 2019
Sold by
Hpa Borrower 2018 Ms Llc
Bought by
Wightman Trevor and Wightman Nova
Current Estimated Value
Purchase Details
Closed on
Jul 13, 2018
Sold by
Hp Minnesota I Llc
Bought by
Hpa Borrower 2018 1 Ms Llc
Purchase Details
Closed on
Feb 20, 2018
Sold by
Olsen Patricia M and Olsen Kenneth A
Bought by
Hp Minnesota I Llc
Purchase Details
Closed on
Apr 27, 2001
Sold by
Mccallum Construction Inc
Bought by
Olsen Kenneth A and Olsen Patricia M
Purchase Details
Closed on
Apr 21, 2000
Sold by
S & M International Llc
Bought by
Mccallum Construction Inc
Create a Home Valuation Report for This Property
The Home Valuation Report is an in-depth analysis detailing your home's value as well as a comparison with similar homes in the area
Home Values in the Area
Average Home Value in this Area
Purchase History
| Date | Buyer | Sale Price | Title Company |
|---|---|---|---|
| Wightman Trevor | $485,500 | Burnet Title | |
| Hpa Borrower 2018 1 Ms Llc | -- | Stewart Title | |
| Hp Minnesota I Llc | $468,000 | Burnet Title | |
| Olsen Kenneth A | $435,000 | -- | |
| Mccallum Construction Inc | $90,000 | -- | |
| S & M International Llc | $60,000 | -- |
Source: Public Records
Tax History Compared to Growth
Tax History
| Year | Tax Paid | Tax Assessment Tax Assessment Total Assessment is a certain percentage of the fair market value that is determined by local assessors to be the total taxable value of land and additions on the property. | Land | Improvement |
|---|---|---|---|---|
| 2025 | $7,891 | $651,700 | $144,000 | $507,700 |
| 2024 | $7,891 | $631,800 | $137,000 | $494,800 |
| 2023 | $6,962 | $612,000 | $121,900 | $490,100 |
| 2022 | $6,666 | $607,700 | $109,800 | $497,900 |
| 2021 | $6,574 | $513,000 | $84,200 | $428,800 |
| 2020 | $6,327 | $494,500 | $93,600 | $400,900 |
| 2019 | $5,998 | $457,500 | $89,700 | $367,800 |
| 2018 | $5,593 | $409,800 | $0 | $0 |
| 2017 | $5,569 | $415,800 | $0 | $0 |
| 2016 | $5,826 | $396,700 | $0 | $0 |
| 2015 | $5,523 | $396,700 | $113,400 | $283,300 |
| 2014 | -- | $350,900 | $110,800 | $240,100 |
Source: Public Records
Map
Nearby Homes
- 1428 Sherman Lake Rd
- 1367 Wolf Cir
- 1469 Sherman Lake Rd
- 6733 Timberwolf Trail
- 1610 Widgeon Cir
- 1707 Dupre Rd
- 7037 Lamotte Dr
- 1425 Holly Dr E
- 6542 Black Duck Dr S
- 6961 Meadow Ct
- 1554 Holly Dr E
- 1159 Durango Point
- 1080 Killdeer Ct
- 6868 Dupre Rd
- 6408 Cassiopeia Ct
- 7057 Dupre Rd
- 7239 Main St
- 6478 Fox Rd
- 1988 Norma Way
- 907 Fox Rd
- 6713 Teal Ct
- 6725 Teal Ct
- 6724 Teal Ct
- 6707 Teal Ct
- 6712 Teal Ct
- 6731 Teal Ct
- 6701 Teal Ct
- 6706 Teal Ct
- 6737 Teal Ct
- 6728 Teal Ct
- 1387 Hunters Ridge
- 1431 Sherman Lake Rd
- 1393 Hunters Ridge
- 6734 Teal Ct
- 6743 Teal Ct
- 1381 Hunters Ridge
- 1435 Sherman Lake Rd
- 1399 Hunters Ridge
- 6740 Teal Ct
- 1423 Sherman Lake Rd