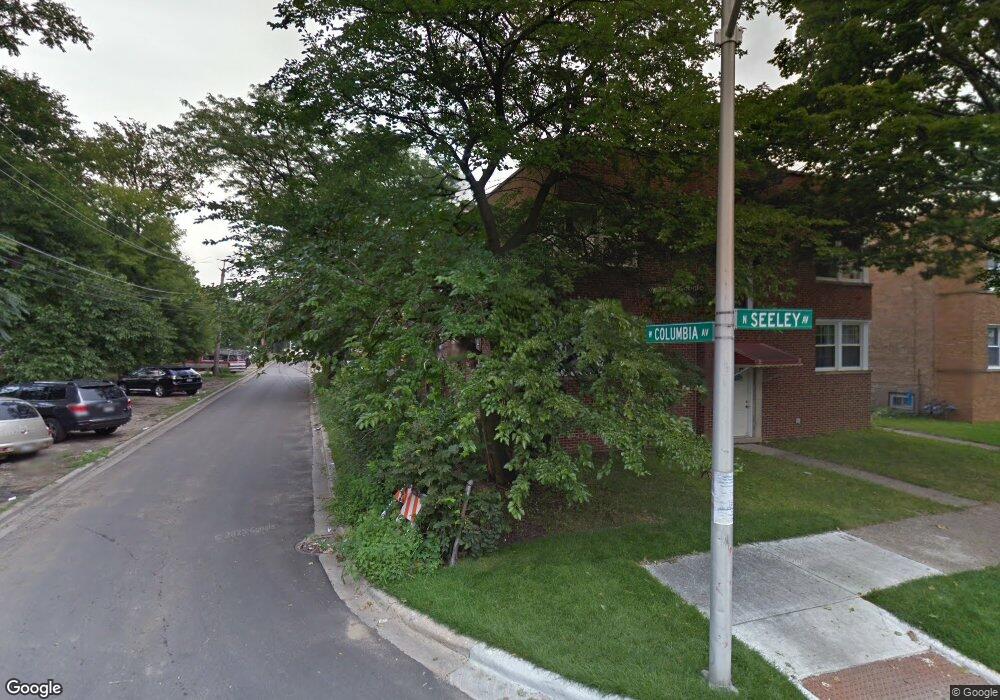
6725 N Seeley Ave Unit 67251N Chicago, IL 60645
West Ridge NeighborhoodEstimated Value: $188,000 - $219,382
3
Beds
1
Bath
1,200
Sq Ft
$172/Sq Ft
Est. Value
About This Home
This home is located at 6725 N Seeley Ave Unit 67251N, Chicago, IL 60645 and is currently estimated at $205,846, approximately $171 per square foot. 6725 N Seeley Ave Unit 67251N is a home located in Cook County with nearby schools including George Armstrong Elementary School, Sullivan High School, and Northside Catholic Academy.
Ownership History
Date
Name
Owned For
Owner Type
Purchase Details
Closed on
Sep 3, 2020
Sold by
Youel Esho
Bought by
Alam Fakhri
Current Estimated Value
Home Financials for this Owner
Home Financials are based on the most recent Mortgage that was taken out on this home.
Original Mortgage
$141,443
Interest Rate
3.25%
Mortgage Type
New Conventional
Purchase Details
Closed on
Oct 5, 2004
Sold by
Chan Yuen Sun and Chan Shui Ying
Bought by
Youel Esho
Home Financials for this Owner
Home Financials are based on the most recent Mortgage that was taken out on this home.
Original Mortgage
$136,000
Interest Rate
5.93%
Mortgage Type
Purchase Money Mortgage
Purchase Details
Closed on
Sep 4, 2001
Sold by
Lasalle Bank National Assn
Bought by
Chan Yuen Sun and Chan Shui Ying
Create a Home Valuation Report for This Property
The Home Valuation Report is an in-depth analysis detailing your home's value as well as a comparison with similar homes in the area
Home Values in the Area
Average Home Value in this Area
Purchase History
| Date | Buyer | Sale Price | Title Company |
|---|---|---|---|
| Alam Fakhri | $149,000 | Attorney | |
| Youel Esho | $170,000 | Lawyers | |
| Chan Yuen Sun | -- | -- |
Source: Public Records
Mortgage History
| Date | Status | Borrower | Loan Amount |
|---|---|---|---|
| Previous Owner | Alam Fakhri | $141,443 | |
| Previous Owner | Youel Esho | $136,000 |
Source: Public Records
Tax History Compared to Growth
Tax History
| Year | Tax Paid | Tax Assessment Tax Assessment Total Assessment is a certain percentage of the fair market value that is determined by local assessors to be the total taxable value of land and additions on the property. | Land | Improvement |
|---|---|---|---|---|
| 2024 | $2,954 | $17,641 | $4,149 | $13,492 |
| 2023 | $2,879 | $14,000 | $3,319 | $10,681 |
| 2022 | $2,879 | $14,000 | $3,319 | $10,681 |
| 2021 | $2,815 | $13,999 | $3,318 | $10,681 |
| 2020 | $2,866 | $12,864 | $3,134 | $9,730 |
| 2019 | $2,867 | $14,270 | $3,134 | $11,136 |
| 2018 | $2,819 | $14,270 | $3,134 | $11,136 |
| 2017 | $2,846 | $13,219 | $2,765 | $10,454 |
| 2016 | $1,790 | $13,219 | $2,765 | $10,454 |
| 2015 | $2,422 | $13,219 | $2,765 | $10,454 |
| 2014 | $1,410 | $12,000 | $2,489 | $9,511 |
| 2013 | $1,363 | $12,000 | $2,489 | $9,511 |
Source: Public Records
Map
Nearby Homes
- 1937 W Pratt Blvd Unit 2N
- 6561 N Seeley Ave
- 2065 W Farwell Ave Unit 20653N
- 6801 N Wolcott Ave
- 2025 W Arthur Ave Unit C2
- 6500 N Ridge Blvd Unit 4E
- 2130 W Farwell Ave
- 2036 W Morse Ave Unit D
- 2111 W Arthur Ave Unit 1S
- 1958 W Morse Ave Unit B
- 6959 N Ridge Blvd Unit 1C
- 2217 W Farwell Ave Unit 2B
- 6433 N Damen Ave Unit 3E
- 2245 W Farwell Ave Unit 3B
- 1749 W North Shore Ave
- 2241 W Farwell Ave Unit 2D
- 6421 N Damen Ave Unit 1W
- 1745 W North Shore Ave
- 2243 W Farwell Ave Unit 3D
- 6414 N Hoyne Ave Unit 3W
- 6725 N Seeley Ave Unit 1N
- 6723 N Seeley Ave Unit 2S
- 6725 N Seeley Ave Unit 67252N
- 6723 N Seeley Ave Unit 67232S
- 6723 N Seeley Ave Unit 67231S
- 6725 N Seeley Ave Unit 2N
- 6723 N Seeley Ave Unit 2S
- 6723 N Seeley Ave Unit 1S
- 6723 N Seeley Ave Unit 1N
- 6721 N Seeley Ave Unit 67211N
- 6721 N Seeley Ave Unit 67212N
- 6719 N Seeley Ave Unit 67192S
- 6719 N Seeley Ave Unit 67191S
- 6715 N Seeley Ave Unit 67151
- 6715 N Seeley Ave Unit 2S
- 6717 N Seeley Ave Unit 67171
- 6717 N Seeley Ave Unit 67152
- 6717 N Seeley Ave Unit 67172
- 6726 N Seeley Ave Unit 2N
- 6726 N Seeley Ave Unit 1N