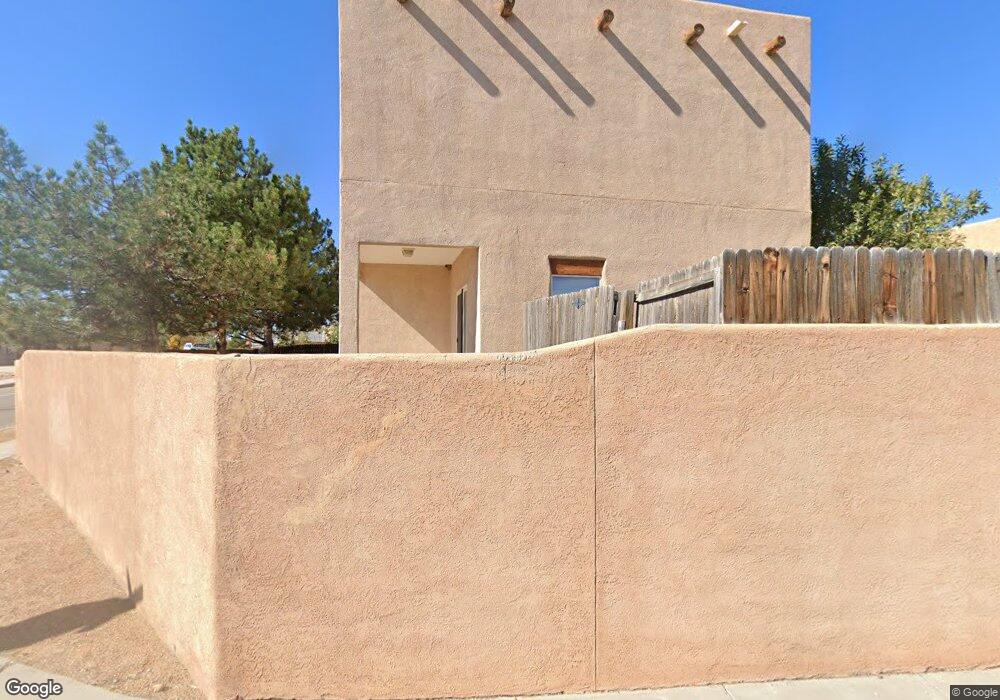
6746 Camino Rojo Santa Fe, NM 87507
Tierra Contenta NeighborhoodEstimated Value: $412,000 - $523,000
2
Beds
2
Baths
1,868
Sq Ft
$248/Sq Ft
Est. Value
About This Home
This home is located at 6746 Camino Rojo, Santa Fe, NM 87507 and is currently estimated at $462,591, approximately $247 per square foot. 6746 Camino Rojo is a home located in Santa Fe County with nearby schools including Nina Otero Community School, Capital High School, and Santa Fe School for the Arts & Sciences.
Ownership History
Date
Name
Owned For
Owner Type
Purchase Details
Closed on
Aug 25, 2005
Sold by
Martinez Doreen P
Bought by
Alire David N and Martinez Marie L
Current Estimated Value
Home Financials for this Owner
Home Financials are based on the most recent Mortgage that was taken out on this home.
Original Mortgage
$164,000
Outstanding Balance
$86,413
Interest Rate
5.61%
Mortgage Type
Fannie Mae Freddie Mac
Estimated Equity
$376,178
Purchase Details
Closed on
Nov 26, 2002
Sold by
Beaver James W and May James H
Bought by
Martinez Doreen P
Home Financials for this Owner
Home Financials are based on the most recent Mortgage that was taken out on this home.
Original Mortgage
$194,750
Interest Rate
6.13%
Purchase Details
Closed on
Sep 27, 2002
Sold by
Centex Homes
Bought by
May James and Beaver James
Home Financials for this Owner
Home Financials are based on the most recent Mortgage that was taken out on this home.
Original Mortgage
$194,750
Interest Rate
6.13%
Create a Home Valuation Report for This Property
The Home Valuation Report is an in-depth analysis detailing your home's value as well as a comparison with similar homes in the area
Home Values in the Area
Average Home Value in this Area
Purchase History
| Date | Buyer | Sale Price | Title Company |
|---|---|---|---|
| Alire David N | -- | Sfa | |
| Martinez Doreen P | -- | Southwestern Title & Escrow | |
| May James | -- | Southwestern Title & Escrow |
Source: Public Records
Mortgage History
| Date | Status | Borrower | Loan Amount |
|---|---|---|---|
| Open | Alire David N | $164,000 | |
| Previous Owner | Martinez Doreen P | $194,750 |
Source: Public Records
Tax History Compared to Growth
Tax History
| Year | Tax Paid | Tax Assessment Tax Assessment Total Assessment is a certain percentage of the fair market value that is determined by local assessors to be the total taxable value of land and additions on the property. | Land | Improvement |
|---|---|---|---|---|
| 2024 | $1,961 | $263,332 | $65,670 | $197,662 |
| 2023 | $1,960 | $255,663 | $63,758 | $191,905 |
| 2022 | $1,915 | $248,217 | $61,901 | $186,316 |
| 2021 | $1,884 | $80,330 | $20,032 | $60,298 |
| 2020 | $1,826 | $77,990 | $19,449 | $58,541 |
| 2019 | $1,848 | $75,719 | $18,883 | $56,836 |
| 2018 | $1,807 | $73,514 | $18,333 | $55,181 |
| 2017 | $1,762 | $71,373 | $18,333 | $53,040 |
| 2016 | $1,661 | $69,294 | $18,333 | $50,961 |
| 2015 | $1,623 | $67,276 | $18,333 | $48,943 |
| 2014 | $1,526 | $65,251 | $18,315 | $46,936 |
Source: Public Records
Map
Nearby Homes
- 4616 Apache Knoll
- 4631 Sunset Ridge
- 6795 Camino Rojo
- 6808 Sunset Cir
- 6963 Golden Mesa
- 6680 Jaguar Dr
- 4748 Vista Del Sol
- 7023 Vuelta Vistoso
- 4228 Roadrunner Ln
- 4144 Cheyenne Cir
- 4702 Solecito Way
- 4037 Fairly
- 4056 Fairly
- 6442 Cerros Grandes Dr
- 4048 Fairly
- 4042 Fairly
- 4067 Fairly
- 4116 Cheyenne Cir
- 4051 Fairly
- 4049 Fairly Rd
- 6744 Camino Rojo
- 6748 Camino Rojo
- 6750 Camino Rojo
- 6800 Valentine Way
- 6726 Camino Rojo
- 6804 Valentine Way
- 6762 Camino Rojo
- 6728 Camino Rojo
- 6796 Valentine Way
- 6760 Camino Rojo
- 6743 Camino Rojo
- 6808 Valentine Way
- 6733 Camino Rojo
- 6724 Camino Rojo
- 4602 Sunset Ridge
- 4603 Apache Knoll
- 6764 Camino Rojo
- 6722 Camino Rojo
- 4606 Sunset Ridge
- 6751 Camino Rojo