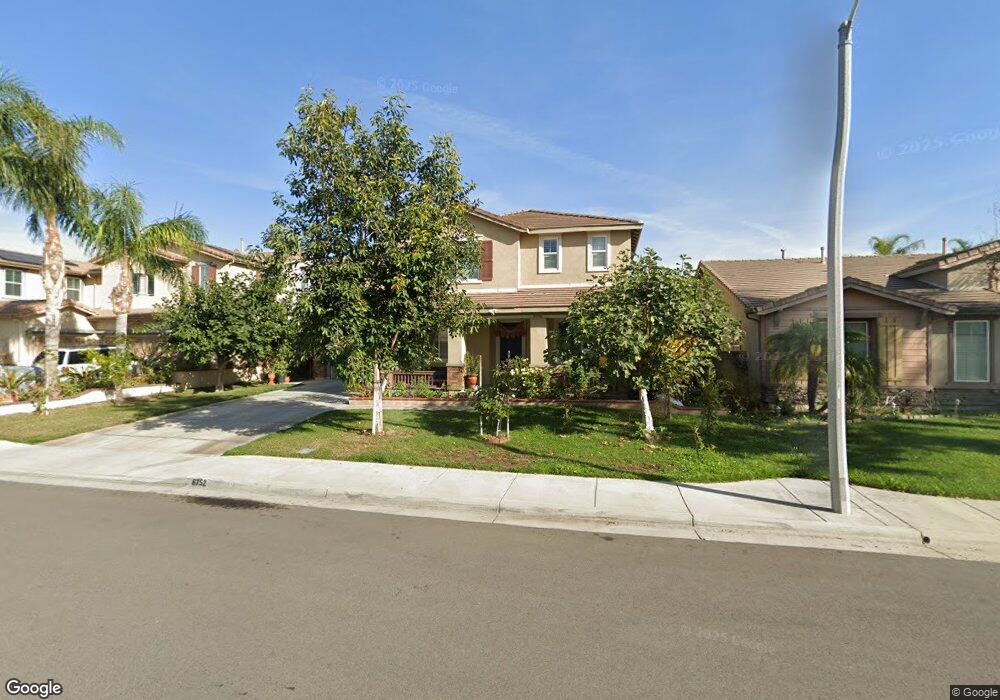
6752 Stillbrook Way Corona, CA 92880
Estimated Value: $1,071,761 - $1,163,000
4
Beds
4
Baths
3,924
Sq Ft
$290/Sq Ft
Est. Value
About This Home
This home is located at 6752 Stillbrook Way, Corona, CA 92880 and is currently estimated at $1,137,690, approximately $289 per square foot. 6752 Stillbrook Way is a home located in Riverside County with nearby schools including Rosa Parks Elementary School, Dr. Augustine Ramirez Intermediate School, and Eleanor Roosevelt High School.
Ownership History
Date
Name
Owned For
Owner Type
Purchase Details
Closed on
May 3, 2021
Sold by
Kalsaria Jitendra J and Kalsaria Amiben J
Bought by
Kalsaria Amiben J and Patel Yeshaben
Current Estimated Value
Purchase Details
Closed on
May 4, 2010
Sold by
Kalsaria Amiben J and Kalsaria Jitendra J
Bought by
Kalsaria Jitendra J and Kalsaria Amiben J
Home Financials for this Owner
Home Financials are based on the most recent Mortgage that was taken out on this home.
Original Mortgage
$381,000
Outstanding Balance
$255,244
Interest Rate
5.04%
Mortgage Type
New Conventional
Estimated Equity
$882,446
Purchase Details
Closed on
Aug 21, 2008
Sold by
Centex Homes
Bought by
Kalsaria Amiben J and Kalsaria Jitendra J
Home Financials for this Owner
Home Financials are based on the most recent Mortgage that was taken out on this home.
Original Mortgage
$387,192
Interest Rate
6.27%
Mortgage Type
Purchase Money Mortgage
Create a Home Valuation Report for This Property
The Home Valuation Report is an in-depth analysis detailing your home's value as well as a comparison with similar homes in the area
Home Values in the Area
Average Home Value in this Area
Purchase History
| Date | Buyer | Sale Price | Title Company |
|---|---|---|---|
| Kalsaria Amiben J | -- | First American Title Ins Co | |
| Kalsaria Jitendra J | -- | First American Title Lenders | |
| Kalsaria Amiben J | $484,000 | Commerce Title Company |
Source: Public Records
Mortgage History
| Date | Status | Borrower | Loan Amount |
|---|---|---|---|
| Open | Kalsaria Jitendra J | $381,000 | |
| Closed | Kalsaria Amiben J | $387,192 |
Source: Public Records
Tax History Compared to Growth
Tax History
| Year | Tax Paid | Tax Assessment Tax Assessment Total Assessment is a certain percentage of the fair market value that is determined by local assessors to be the total taxable value of land and additions on the property. | Land | Improvement |
|---|---|---|---|---|
| 2025 | $10,971 | $722,948 | $161,659 | $561,289 |
| 2023 | $10,971 | $694,878 | $155,383 | $539,495 |
| 2022 | $10,652 | $681,254 | $152,337 | $528,917 |
| 2021 | $9,485 | $575,796 | $148,702 | $427,094 |
| 2020 | $9,369 | $569,893 | $147,178 | $422,715 |
| 2019 | $9,559 | $558,720 | $144,293 | $414,427 |
| 2018 | $9,294 | $547,765 | $141,465 | $406,300 |
| 2017 | $9,225 | $537,026 | $138,692 | $398,334 |
| 2016 | $9,141 | $526,497 | $135,973 | $390,524 |
| 2015 | $8,950 | $518,591 | $133,932 | $384,659 |
| 2014 | $8,900 | $508,434 | $131,309 | $377,125 |
Source: Public Records
Map
Nearby Homes
- 14010 Barnett Ln
- 6851 Tourmaline Dr
- 6552 Gold Dust St
- 6522 Gold Dust St
- 6890 Monte Vista Ct
- 13894 Blue Ribbon Ln
- 6536 Pimlico Place
- 14301 Florence St
- 14037 Hollywood Ave
- 6562 Crescendo Ct
- 6674 Ashford Mill Ct
- 6650 Ashford Mill Ct
- 7042 Logsdon Dr
- 14468 Runyon Dr
- 6052 Arches Way
- 6037 Arches Way
- 12981 Paradiso Dr
- 12967 Paradiso Dr
- 7203 Twinspur Ct
- 13742 Woodcrest Ct
- 6742 Stillbrook Way
- 6762 Stillbrook Way
- 6753 Belynn Ct
- 6743 Belynn Ct
- 6763 Belynn Ct
- 6732 Stillbrook Way
- 6772 Stillbrook Way
- 6755 Stillbrook Way
- 6773 Belynn Ct
- 6745 Stillbrook Way
- 6765 Stillbrook Way
- 6733 Belynn Ct
- 6775 Stillbrook Way
- 6735 Stillbrook Way
- 6722 Stillbrook Way
- 6723 Belynn Ct
- 6754 Havenhurst St
- 6750 Belynn Ct
- 6764 Havenhurst St
- 6744 Havenhurst St