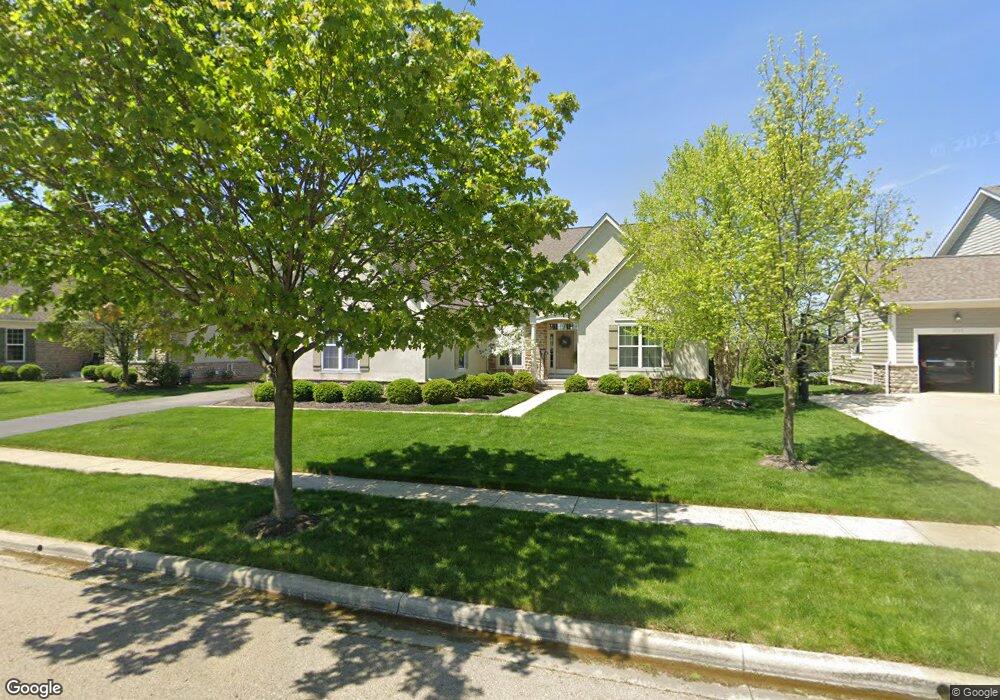
6768 Trafalgar Loop Dublin, OH 43016
Estimated Value: $661,158 - $874,000
4
Beds
3
Baths
3,082
Sq Ft
$241/Sq Ft
Est. Value
About This Home
This home is located at 6768 Trafalgar Loop, Dublin, OH 43016 and is currently estimated at $741,790, approximately $240 per square foot. 6768 Trafalgar Loop is a home located in Franklin County with nearby schools including Washington Elementary School, Hilliard Tharp Sixth Grade Elementary School, and Hilliard Weaver Middle School.
Ownership History
Date
Name
Owned For
Owner Type
Purchase Details
Closed on
Mar 31, 2011
Sold by
Ritter Adam N and Ritter Emily A
Bought by
Gehring Gregg G
Current Estimated Value
Home Financials for this Owner
Home Financials are based on the most recent Mortgage that was taken out on this home.
Original Mortgage
$344,662
Outstanding Balance
$220,661
Interest Rate
3.62%
Mortgage Type
FHA
Estimated Equity
$521,130
Purchase Details
Closed on
Feb 22, 2008
Sold by
Truberry Group Inc
Bought by
Ritter Adam N and Ritter Emily A
Home Financials for this Owner
Home Financials are based on the most recent Mortgage that was taken out on this home.
Original Mortgage
$300,000
Interest Rate
5.75%
Mortgage Type
Purchase Money Mortgage
Purchase Details
Closed on
Aug 17, 2004
Sold by
Edwards Golf Communities Llc
Bought by
Truberry Group Inc
Create a Home Valuation Report for This Property
The Home Valuation Report is an in-depth analysis detailing your home's value as well as a comparison with similar homes in the area
Home Values in the Area
Average Home Value in this Area
Purchase History
| Date | Buyer | Sale Price | Title Company |
|---|---|---|---|
| Gehring Gregg G | $369,500 | Chicago Tit | |
| Ritter Adam N | $400,000 | Stewart Tit | |
| Truberry Group Inc | $1,003,000 | Stewart Tit |
Source: Public Records
Mortgage History
| Date | Status | Borrower | Loan Amount |
|---|---|---|---|
| Open | Gehring Gregg G | $344,662 | |
| Previous Owner | Ritter Adam N | $300,000 |
Source: Public Records
Tax History
| Year | Tax Paid | Tax Assessment Tax Assessment Total Assessment is a certain percentage of the fair market value that is determined by local assessors to be the total taxable value of land and additions on the property. | Land | Improvement |
|---|---|---|---|---|
| 2025 | $11,657 | $191,210 | $49,000 | $142,210 |
| 2024 | $11,657 | $191,210 | $49,000 | $142,210 |
| 2023 | $10,487 | $191,205 | $49,000 | $142,205 |
| 2022 | $9,286 | $138,530 | $38,500 | $100,030 |
| 2021 | $9,508 | $137,800 | $38,500 | $99,300 |
| 2020 | $9,219 | $137,800 | $38,500 | $99,300 |
| 2019 | $9,798 | $125,340 | $35,000 | $90,340 |
| 2018 | $9,937 | $125,340 | $35,000 | $90,340 |
| 2017 | $10,239 | $125,340 | $35,000 | $90,340 |
| 2016 | $10,709 | $127,370 | $29,400 | $97,970 |
| 2015 | $10,105 | $127,370 | $29,400 | $97,970 |
| 2014 | $10,125 | $127,370 | $29,400 | $97,970 |
| 2013 | $4,897 | $121,310 | $28,000 | $93,310 |
Source: Public Records
Map
Nearby Homes
- 5844 Dunheath Loop
- 7074 Dornell Ct
- 7071 Dornell Ct
- 5751 Cosgray Rd
- 7013 Wind Rose Way Unit 42
- 5523 Ballantrae Woods Dr
- 6295 Donegan Way
- 6928 Barksdale Dr
- 6235 Donegan Way
- 6231 Donegan Way Unit 11
- 7093 Rings Rd
- 6986 Stillhouse Ln
- 6293 Hampton Green Place Unit 12C
- 6946 Stillhouse Ln
- 6938 Stillhouse Ln
- 7029 Post Preserve Blvd
- 6105 Craughwell Ln
- 6219 Craughwell Ln
- 6178 Turvey Loop W Unit 6178
- 6756 Weldon Rd
- 6776 Trafalgar Loop
- 6776 Trafalgar Loop Unit 440
- 6760 Trafalgar Loop
- 6784 Trafalgar Loop
- 6752 Trafalgar Loop
- 6749 Trafalgar Loop
- 6765 Trafalgar Loop
- 6783 Trafalgar Loop
- 6733 Trafalgar Loop
- 6744 Trafalgar Loop
- 6792 Trafalgar Loop
- 6072 Trafalgar Ln
- 6736 Trafalgar Loop
- 6807 Trafalgar Loop
- 6725 Trafalgar Loop
- 6800 Trafalgar Loop
- 6064 Trafalgar Ln
- 6720 Trafalgar Loop
- 6728 Trafalgar Loop
- 6728 Trafalgar Loop Unit 446
Your Personal Tour Guide
Ask me questions while you tour the home.