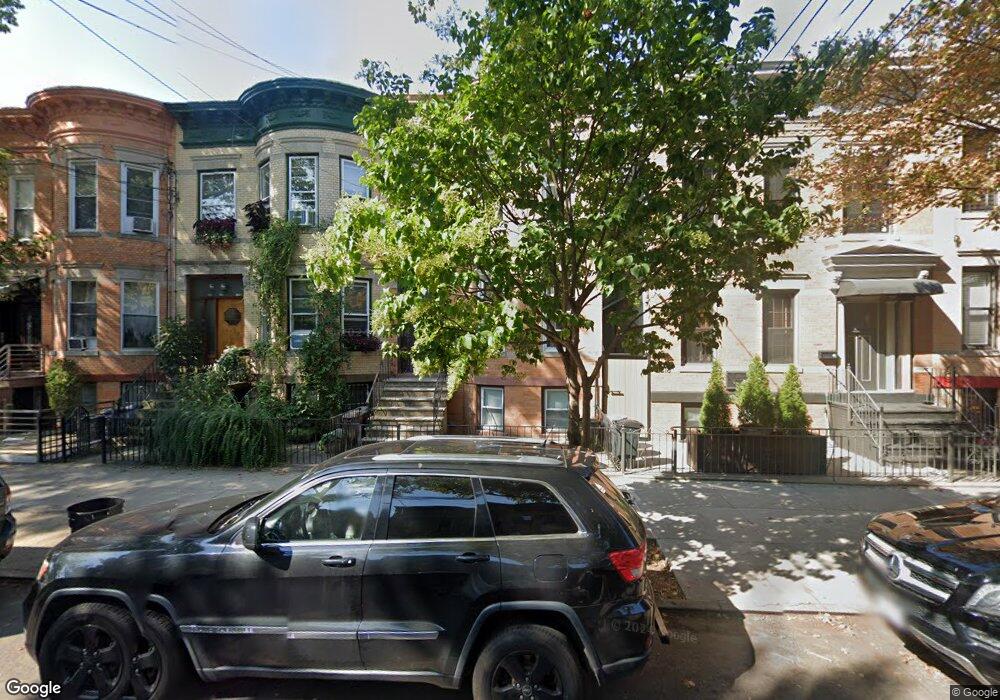
68-20 64th Place Unit 2-FLR Flushing, NY 11385
Ridgewood NeighborhoodEstimated Value: $1,026,573 - $1,606,000
2
Beds
1
Bath
1,000
Sq Ft
$1,288/Sq Ft
Est. Value
About This Home
This home is located at 68-20 64th Place Unit 2-FLR, Flushing, NY 11385 and is currently estimated at $1,287,643, approximately $1,287 per square foot. 68-20 64th Place Unit 2-FLR is a home located in Queens County with nearby schools including P.S. 91 - Richard Arkwright, I.S. 119 the Glendale, and Sacred Heart School.
Ownership History
Date
Name
Owned For
Owner Type
Purchase Details
Closed on
Dec 22, 2011
Sold by
Dimurro Anthony and Dimurro Julie
Bought by
Morisi Franco and Morisi Stefano
Current Estimated Value
Home Financials for this Owner
Home Financials are based on the most recent Mortgage that was taken out on this home.
Original Mortgage
$325,000
Outstanding Balance
$222,002
Interest Rate
3.98%
Estimated Equity
$1,065,641
Purchase Details
Closed on
Dec 21, 2005
Sold by
Borer Alan and Estate Of Marjorie Borer
Bought by
Dimurro Anthony and Dimurro Julie
Home Financials for this Owner
Home Financials are based on the most recent Mortgage that was taken out on this home.
Original Mortgage
$86,000
Interest Rate
6.28%
Purchase Details
Closed on
Nov 24, 1997
Sold by
Mullahey Dorothy
Bought by
Maffei Carolyn and Mullahey Dorothy
Create a Home Valuation Report for This Property
The Home Valuation Report is an in-depth analysis detailing your home's value as well as a comparison with similar homes in the area
Home Values in the Area
Average Home Value in this Area
Purchase History
| Date | Buyer | Sale Price | Title Company |
|---|---|---|---|
| Morisi Franco | $568,000 | -- | |
| Morisi Franco | $568,000 | -- | |
| Dimurro Anthony | $575,000 | -- | |
| Dimurro Anthony | $575,000 | -- | |
| Maffei Carolyn | -- | -- | |
| Maffei Carolyn | -- | -- |
Source: Public Records
Mortgage History
| Date | Status | Borrower | Loan Amount |
|---|---|---|---|
| Open | Morisi Franco | $325,000 | |
| Closed | Morisi Franco | $325,000 | |
| Previous Owner | Dimurro Anthony | $86,000 | |
| Previous Owner | Dimurro Anthony | $460,000 |
Source: Public Records
Tax History Compared to Growth
Tax History
| Year | Tax Paid | Tax Assessment Tax Assessment Total Assessment is a certain percentage of the fair market value that is determined by local assessors to be the total taxable value of land and additions on the property. | Land | Improvement |
|---|---|---|---|---|
| 2025 | $8,272 | $43,316 | $5,758 | $37,558 |
| 2024 | $8,272 | $41,184 | $5,992 | $35,192 |
| 2023 | $8,117 | $40,415 | $4,965 | $35,450 |
| 2022 | $7,638 | $63,900 | $9,420 | $54,480 |
| 2021 | $7,601 | $68,340 | $9,420 | $58,920 |
| 2020 | $7,641 | $69,060 | $9,420 | $59,640 |
| 2019 | $7,179 | $59,160 | $9,420 | $49,740 |
| 2018 | $6,568 | $33,679 | $7,619 | $26,060 |
| 2017 | $6,200 | $31,886 | $7,810 | $24,076 |
| 2016 | $5,707 | $31,886 | $7,810 | $24,076 |
| 2015 | -- | $30,081 | $7,466 | $22,615 |
| 2014 | -- | $28,600 | $8,520 | $20,080 |
Source: Public Records
Map
Nearby Homes
- 68-26 64th St
- 61-19 Madison St
- 6119 Madison St
- 6046 Putnam Ave
- 60-46 Putnam Ave
- 6924 67th Place
- 70-49 66th Place Unit 2 units
- 70-49 66th Place
- 6813 60th St
- 65-57 Myrtle Ave
- 59-29 69th Ave
- 7402 65th St
- 5938 Madison St
- 5945 Madison St
- 5924 Putnam Ave
- 6157 Linden St
- 59-30 70th Ave
- 65-26 Admiral Ave
- 5921 71st Ave
- 67 67th Place
- 6820 64th Place
- 6822 64th Place
- 6818 64th Place
- 6824 64th Place
- 6816 64th Place
- 6826 64th Place
- 68-26 64th Place Unit Building
- 68-26 64th Place
- 6814 64th Place
- 6828 64th Place
- 6830 64th Place
- 6819 64th St
- 6821 64th St
- 6815 64th St
- 6823 64th St
- 6832 64th Place
- 6823 64th St
- 6825 64th St
- 6834 64th Place
- 6829 64th St