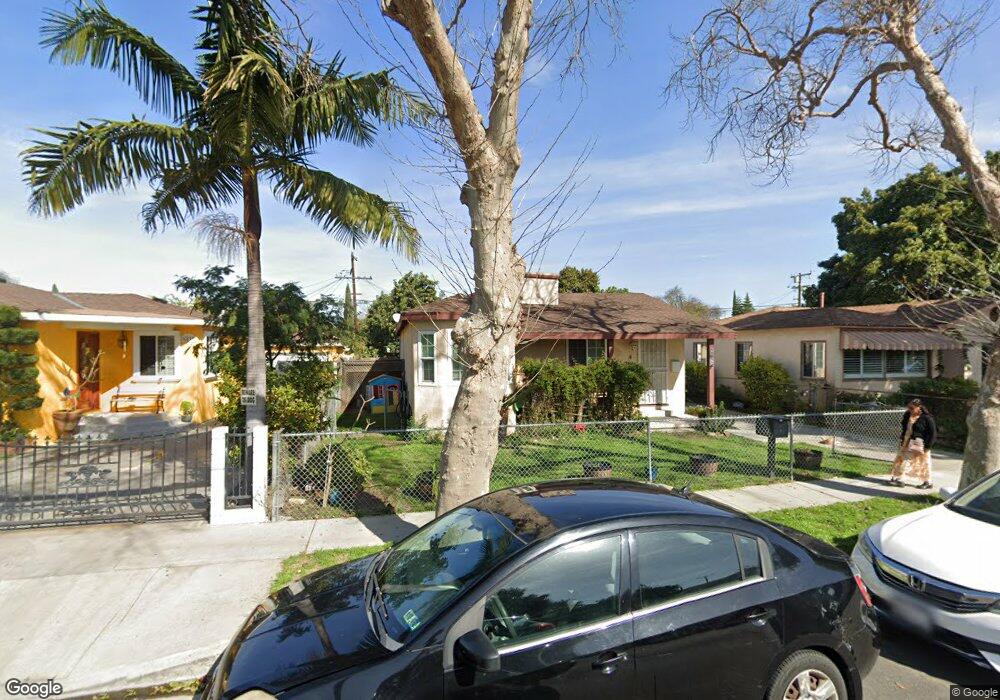
6839 San Marcus St Paramount, CA 90723
Estimated Value: $661,595 - $704,000
3
Beds
1
Bath
954
Sq Ft
$712/Sq Ft
Est. Value
About This Home
This home is located at 6839 San Marcus St, Paramount, CA 90723 and is currently estimated at $679,399, approximately $712 per square foot. 6839 San Marcus St is a home located in Los Angeles County with nearby schools including Los Cerritos School, Frank J. Zamboni School, and Paramount High School.
Ownership History
Date
Name
Owned For
Owner Type
Purchase Details
Closed on
Dec 22, 2021
Sold by
2014 Evelia Mota Trust
Bought by
2015 Miguel A Mota Trust
Current Estimated Value
Purchase Details
Closed on
Sep 3, 2014
Sold by
Mota Evelia
Bought by
Mota Evelia and The 2014 Evelia Mota Trust
Purchase Details
Closed on
Apr 21, 2010
Sold by
Mota Evelia and The Bernardina Mota 2004 Revoc
Bought by
Mota Evelia
Home Financials for this Owner
Home Financials are based on the most recent Mortgage that was taken out on this home.
Original Mortgage
$100,000
Interest Rate
4.92%
Mortgage Type
New Conventional
Purchase Details
Closed on
Apr 27, 2004
Sold by
Mota Bernardina
Bought by
Mota Bernardina and The Bernardina Mota 2004 Revocable Livin
Create a Home Valuation Report for This Property
The Home Valuation Report is an in-depth analysis detailing your home's value as well as a comparison with similar homes in the area
Home Values in the Area
Average Home Value in this Area
Purchase History
| Date | Buyer | Sale Price | Title Company |
|---|---|---|---|
| 2015 Miguel A Mota Trust | -- | Miller & Miller-Bazemore | |
| Mota Evelia | -- | None Available | |
| Mota Evelia | -- | First American Title Company | |
| Mota Bernardina | -- | -- |
Source: Public Records
Mortgage History
| Date | Status | Borrower | Loan Amount |
|---|---|---|---|
| Previous Owner | Mota Evelia | $100,000 |
Source: Public Records
Tax History
| Year | Tax Paid | Tax Assessment Tax Assessment Total Assessment is a certain percentage of the fair market value that is determined by local assessors to be the total taxable value of land and additions on the property. | Land | Improvement |
|---|---|---|---|---|
| 2025 | $5,159 | $389,389 | $300,457 | $88,932 |
| 2024 | $5,159 | $381,755 | $294,566 | $87,189 |
| 2023 | $5,064 | $374,271 | $288,791 | $85,480 |
| 2022 | $3,955 | $285,833 | $218,939 | $66,894 |
| 2021 | $3,865 | $280,230 | $214,647 | $65,583 |
| 2019 | $3,957 | $271,921 | $208,282 | $63,639 |
| 2018 | $3,673 | $266,591 | $204,199 | $62,392 |
| 2016 | $3,302 | $256,241 | $196,271 | $59,970 |
| 2015 | $3,117 | $252,393 | $193,323 | $59,070 |
| 2014 | $3,194 | $247,450 | $189,537 | $57,913 |
Source: Public Records
Map
Nearby Homes
- 7032 Somerset Blvd
- 15137 Gundry Ave Unit F
- 15325 Orange Ave
- 6556 San Vincente St
- 6542 San Luis St
- 14944 Texaco Ave
- 15351 Orange Ave Unit 17
- 6656 Rosecrans Ave Unit N-10
- 6733 Caro St Unit 47
- 15211 S Gibson Ave
- 4810 E San Luis St
- 4934 E San Rafael St
- 16101 Ansmith Ave
- 4623 E Compton Blvd
- 6824 Marcelle St
- 14625 S Frailey Ave
- 5501 Rayborn St
- 14630 S Lime Ave
- 12323 Edgebrook Ave
- 6535 E 72nd St Unit 1
- 6833 San Marcus St
- 6843 San Marcus St
- 6827 San Marcus St
- 6836 San Mateo St
- 6830 San Mateo St
- 6823 San Marcus St
- 14819 Orange Ave
- 6851 San Marcus St
- 14815 Orange Ave
- 6826 San Mateo St
- 14811 Orange Ave
- 6836 San Marcus St
- 6846 San Marcus St
- 6842 San Marcus St
- 6832 San Marcus St
- 6822 San Mateo St
- 14807 Orange Ave
- 6817 San Marcus St
- 6828 San Marcus St
- 6850 San Marcus St
Your Personal Tour Guide
Ask me questions while you tour the home.