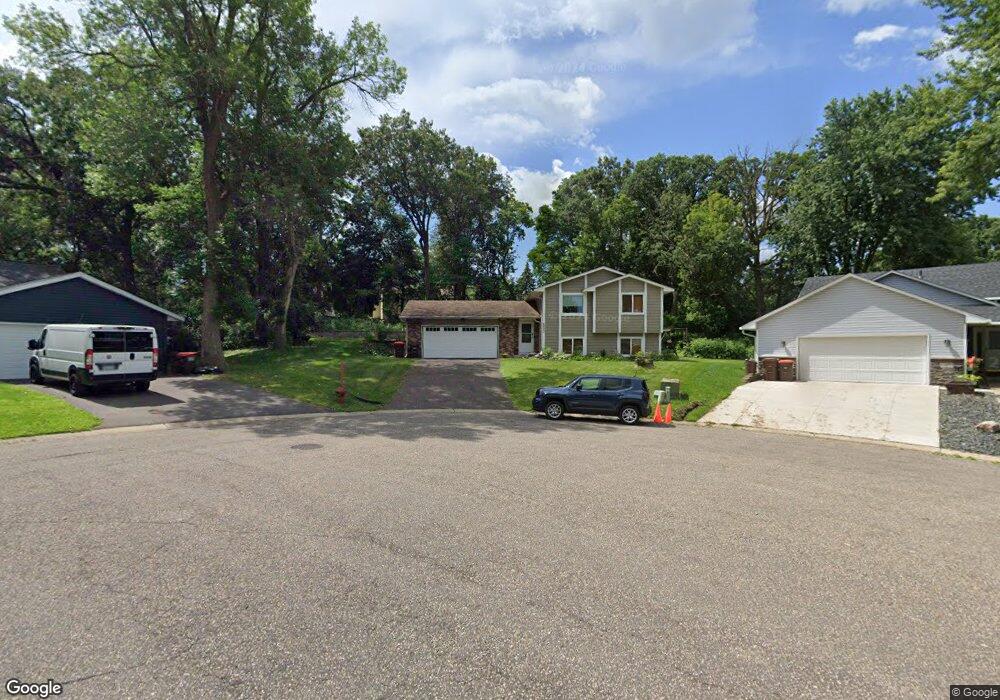
6883 Upper 28th St N Saint Paul, MN 55128
Estimated Value: $352,000 - $397,116
4
Beds
2
Baths
2,077
Sq Ft
$181/Sq Ft
Est. Value
About This Home
This home is located at 6883 Upper 28th St N, Saint Paul, MN 55128 and is currently estimated at $375,279, approximately $180 per square foot. 6883 Upper 28th St N is a home located in Washington County with nearby schools including Cowern Elementary School, Skyview Community Middle School, and Tartan Senior High School.
Ownership History
Date
Name
Owned For
Owner Type
Purchase Details
Closed on
Apr 9, 2021
Sold by
Raimis Construction Llc
Bought by
Rto Investments Llc
Current Estimated Value
Home Financials for this Owner
Home Financials are based on the most recent Mortgage that was taken out on this home.
Original Mortgage
$141,675
Interest Rate
2.93%
Mortgage Type
New Conventional
Purchase Details
Closed on
Feb 4, 2021
Sold by
Caspian Ventures Llc
Bought by
Morales Emilser A and Medina Vanessa S
Purchase Details
Closed on
Dec 28, 2018
Sold by
Caspian Ventures Llc
Bought by
Raimis Construction Llc
Purchase Details
Closed on
Jan 5, 2017
Sold by
Caapian Vetru Llc
Bought by
Morlaes Emilser A and Morlaes Vanessa S
Purchase Details
Closed on
Oct 12, 2016
Sold by
Wells Fargo Bank Na
Bought by
Raimis Construction Llc
Create a Home Valuation Report for This Property
The Home Valuation Report is an in-depth analysis detailing your home's value as well as a comparison with similar homes in the area
Home Values in the Area
Average Home Value in this Area
Purchase History
| Date | Buyer | Sale Price | Title Company |
|---|---|---|---|
| Rto Investments Llc | $500 | Premier Title | |
| Morales Emilser A | -- | Premier Title Ins Agcy Inc | |
| Raimis Construction Llc | -- | West Title Llc | |
| Morlaes Emilser A | -- | None Available | |
| Raimis Construction Llc | $158,200 | None Available |
Source: Public Records
Mortgage History
| Date | Status | Borrower | Loan Amount |
|---|---|---|---|
| Previous Owner | Rto Investments Llc | $141,675 | |
| Closed | Morales Emilser A | $0 |
Source: Public Records
Tax History Compared to Growth
Tax History
| Year | Tax Paid | Tax Assessment Tax Assessment Total Assessment is a certain percentage of the fair market value that is determined by local assessors to be the total taxable value of land and additions on the property. | Land | Improvement |
|---|---|---|---|---|
| 2024 | $4,276 | $362,000 | $136,500 | $225,500 |
| 2023 | $4,276 | $360,900 | $136,500 | $224,400 |
| 2022 | $3,716 | $328,200 | $121,500 | $206,700 |
| 2021 | $3,656 | $274,800 | $102,500 | $172,300 |
| 2020 | $3,734 | $267,800 | $100,500 | $167,300 |
| 2019 | $3,514 | $268,200 | $99,000 | $169,200 |
| 2018 | $3,298 | $249,800 | $95,000 | $154,800 |
| 2017 | $3,266 | $231,500 | $88,000 | $143,500 |
| 2016 | $3,066 | $222,900 | $81,000 | $141,900 |
| 2015 | $3,216 | $220,100 | $81,000 | $139,100 |
| 2013 | -- | $192,700 | $68,900 | $123,800 |
Source: Public Records
Map
Nearby Homes
- 6591 30th Street Ct N
- 2477 Grenadier Ave N
- 7541 Lower 42nd N
- 2569 Hayward Ave N
- 2059 Gresham Ave N
- 2056 Gresham Ave N
- 2033 Gresham Ave N
- 2001 Gresham Ave N Unit 18
- 6510 23rd St N
- 7492 Upper 24th St N
- 2404 Helena Ave N
- 2590 Glenbrook Ave N
- 7602 26th St N
- 2839 Henslow Ave N
- 6551 22nd St N
- 6920 35th St N
- 2851 Hillvale Ct
- 7018 19th St N Unit 1
- 3565 Gresham Ave N
- 2181 Helena Rd N
- 6877 Upper 28th St N
- 6896 27th St N
- 6884 27th St N
- 6855 Upper 28th St N
- 6889 Upper 28th St N
- 6908 27th St N
- 6851 Upper 28th St N
- 6918 27th St N
- 2698 Greystone Ave N
- 6895 Upper 28th St N
- 6891 27th St N
- 2696 Greystone Ave N
- 6864 Upper 28th St N
- 6942 27th St N
- 2807 Gresham Ave N
- 6850 Upper 28th St N
- 2698 Guthrie Ave N
- 6878 Upper 28th St N
- 6956 27th St N
- 2697 Greystone Ave N