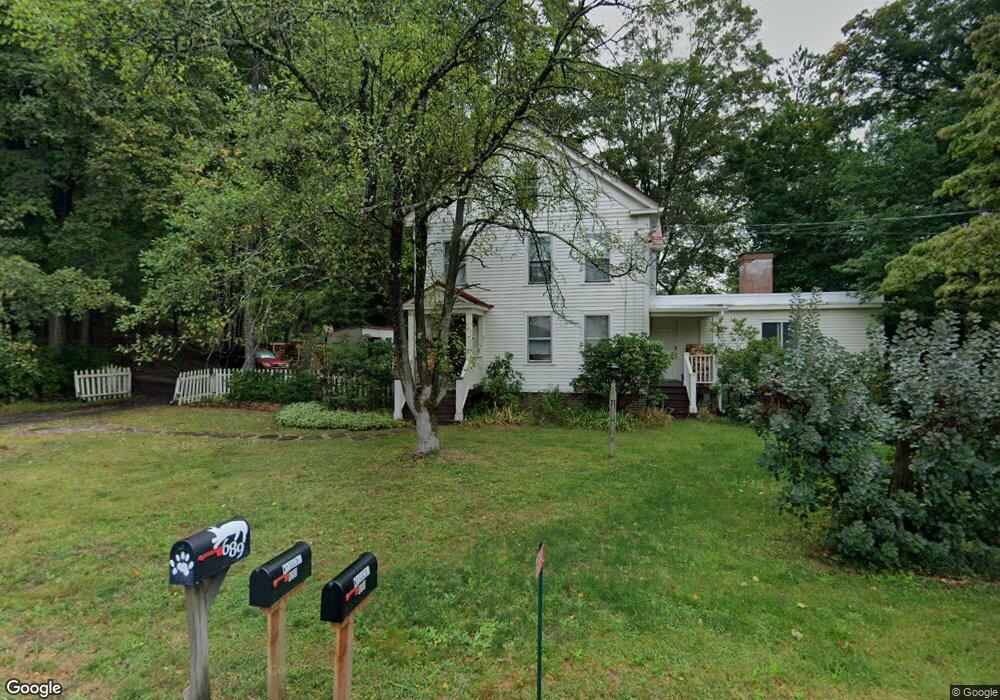
689 N East St Amherst, MA 01002
Estimated Value: $733,127 - $869,000
5
Beds
2
Baths
3,149
Sq Ft
$250/Sq Ft
Est. Value
About This Home
This home is located at 689 N East St, Amherst, MA 01002 and is currently estimated at $787,032, approximately $249 per square foot. 689 N East St is a home located in Hampshire County with nearby schools including Fort River Elementary School, Amherst Regional Middle School, and Amherst Regional High School.
Ownership History
Date
Name
Owned For
Owner Type
Purchase Details
Closed on
Oct 7, 1999
Sold by
Allison Donald J and Allison Edith Adams
Bought by
Mcelroy Christina A and Nuesslein Klaus R L
Current Estimated Value
Home Financials for this Owner
Home Financials are based on the most recent Mortgage that was taken out on this home.
Original Mortgage
$190,000
Outstanding Balance
$57,281
Interest Rate
7.81%
Mortgage Type
Purchase Money Mortgage
Estimated Equity
$729,751
Purchase Details
Closed on
Dec 10, 1993
Sold by
Isaza Luis-Orlando
Bought by
Eagan James E and Tuzman Anne S
Home Financials for this Owner
Home Financials are based on the most recent Mortgage that was taken out on this home.
Original Mortgage
$37,000
Interest Rate
6.78%
Mortgage Type
Purchase Money Mortgage
Create a Home Valuation Report for This Property
The Home Valuation Report is an in-depth analysis detailing your home's value as well as a comparison with similar homes in the area
Home Values in the Area
Average Home Value in this Area
Purchase History
| Date | Buyer | Sale Price | Title Company |
|---|---|---|---|
| Mcelroy Christina A | $260,000 | -- | |
| Eagan James E | $88,000 | -- |
Source: Public Records
Mortgage History
| Date | Status | Borrower | Loan Amount |
|---|---|---|---|
| Open | Eagan James E | $190,000 | |
| Previous Owner | Eagan James E | $50,000 | |
| Previous Owner | Eagan James E | $37,000 |
Source: Public Records
Tax History Compared to Growth
Tax History
| Year | Tax Paid | Tax Assessment Tax Assessment Total Assessment is a certain percentage of the fair market value that is determined by local assessors to be the total taxable value of land and additions on the property. | Land | Improvement |
|---|---|---|---|---|
| 2025 | $110 | $615,400 | $205,100 | $410,300 |
| 2024 | $10,764 | $581,500 | $194,000 | $387,500 |
| 2023 | $10,247 | $509,800 | $176,900 | $332,900 |
| 2022 | $9,646 | $453,500 | $160,500 | $293,000 |
| 2021 | $9,210 | $422,100 | $149,100 | $273,000 |
| 2020 | $8,999 | $422,100 | $149,100 | $273,000 |
| 2019 | $8,705 | $399,300 | $149,100 | $250,200 |
| 2018 | $8,441 | $399,300 | $149,100 | $250,200 |
| 2017 | $8,503 | $389,500 | $142,200 | $247,300 |
| 2016 | $8,265 | $389,500 | $142,200 | $247,300 |
| 2015 | $8,000 | $389,500 | $142,200 | $247,300 |
Source: Public Records
Map
Nearby Homes
- 237 Shutesbury Rd
- Lot A Kingman Rd
- 185 Cherry Ln
- 305 Strong St
- 110 Grantwood Dr
- 13 Harlow Dr
- 17 Juniper Ln
- 53 Henry St
- 66 Harlow Dr
- 958 E Pleasant St
- 60 Red Gate Ln
- 0 Henry St
- 0 Red Gate Ln Unit 73348273
- 75 State St
- 74 N Whitney St
- 785 Main St
- 112 Leverett Rd
- 12 Moorland St
- 24 Moorland St
- Lot 3A-3 Leverett Rd