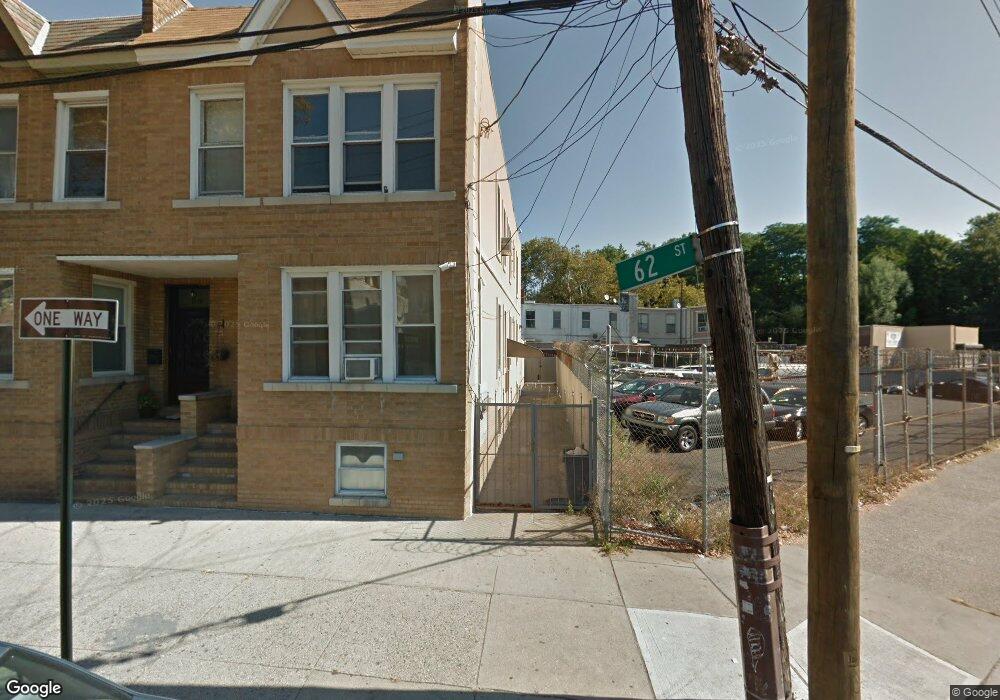
69-59 62nd St Unit 2 R Flushing, NY 11385
Ridgewood NeighborhoodEstimated Value: $1,183,000 - $1,242,527
2
Beds
1
Bath
3,186
Sq Ft
$380/Sq Ft
Est. Value
About This Home
This home is located at 69-59 62nd St Unit 2 R, Flushing, NY 11385 and is currently estimated at $1,209,382, approximately $379 per square foot. 69-59 62nd St Unit 2 R is a home located in Queens County with nearby schools including P.S. 91 - Richard Arkwright, I.S. 119 the Glendale, and Elm Community Charter School.
Ownership History
Date
Name
Owned For
Owner Type
Purchase Details
Closed on
Jul 20, 2022
Sold by
Gao Yin Qun and Ke Wu Kuan
Bought by
Gao Chu Wei
Current Estimated Value
Purchase Details
Closed on
Nov 8, 2013
Sold by
Shimunov Marik
Bought by
Gao Yin Qun and Ke Wu Ruan
Home Financials for this Owner
Home Financials are based on the most recent Mortgage that was taken out on this home.
Original Mortgage
$487,500
Outstanding Balance
$363,841
Interest Rate
4.25%
Mortgage Type
New Conventional
Estimated Equity
$845,541
Purchase Details
Closed on
Sep 18, 2003
Sold by
Ardelean Ana and Ardelean Iosa
Bought by
Shimunov Marik
Home Financials for this Owner
Home Financials are based on the most recent Mortgage that was taken out on this home.
Original Mortgage
$322,700
Interest Rate
6.01%
Mortgage Type
Purchase Money Mortgage
Purchase Details
Closed on
Jun 9, 2003
Sold by
Brambach Lucie and Brambach Walter
Bought by
Ardelean Ana and Ardelean Iosa
Create a Home Valuation Report for This Property
The Home Valuation Report is an in-depth analysis detailing your home's value as well as a comparison with similar homes in the area
Home Values in the Area
Average Home Value in this Area
Purchase History
| Date | Buyer | Sale Price | Title Company |
|---|---|---|---|
| Gao Chu Wei | -- | -- | |
| Gao Yin Qun | $750,000 | -- | |
| Shimunov Marik | $360,000 | -- | |
| Ardelean Ana | $370,000 | -- |
Source: Public Records
Mortgage History
| Date | Status | Borrower | Loan Amount |
|---|---|---|---|
| Open | Gao Yin Qun | $487,500 | |
| Previous Owner | Shimunov Marik | $322,700 | |
| Closed | Ardelean Ana | $0 |
Source: Public Records
Tax History Compared to Growth
Tax History
| Year | Tax Paid | Tax Assessment Tax Assessment Total Assessment is a certain percentage of the fair market value that is determined by local assessors to be the total taxable value of land and additions on the property. | Land | Improvement |
|---|---|---|---|---|
| 2025 | $9,316 | $49,042 | $7,369 | $41,673 |
| 2024 | $9,316 | $46,382 | $7,638 | $38,744 |
| 2023 | $8,813 | $43,877 | $7,583 | $36,294 |
| 2022 | $8,759 | $71,100 | $12,360 | $58,740 |
| 2021 | $9,094 | $76,080 | $12,360 | $63,720 |
| 2020 | $8,651 | $83,640 | $12,360 | $71,280 |
| 2019 | $8,086 | $71,640 | $12,360 | $59,280 |
| 2018 | $7,649 | $36,564 | $6,438 | $30,126 |
| 2017 | $7,454 | $36,564 | $7,709 | $28,855 |
| 2016 | $7,199 | $36,564 | $7,709 | $28,855 |
Source: Public Records
Map
Nearby Homes
- 68-26 64th St
- 70-30 65th Place
- 7402 65th St
- 7447 62nd St
- 59-40 Myrtle Ave
- 5921 71st Ave
- 59-30 70th Ave
- 59-29 69th Ave
- 75-16 62nd St
- 6813 60th St
- 70-49 66th Place Unit 2 units
- 70-49 66th Place
- 74-40 65th St
- 75-09 60th Place
- 647 Cooper Ave
- 7520 64th Place
- 75-27 61st St
- 60-46 Putnam Ave
- 6046 Putnam Ave
- 74-33 65th St
- 69-59 62nd St Unit 1 FL
- 69-59 62nd St
- 6959 62nd St
- 69-57 62nd St
- 6957 62nd St
- 69-55 62 St Unit 1
- 69-55 62nd St Unit 1
- 69-55 62nd St Unit 2
- 6955 62nd St
- 6953 62nd St
- 6951 62nd St
- 69-49 62nd St
- 6949 62nd St
- 7022 Cypress Hills St
- 6962 64th St
- 6964 64th St
- 6960 64th St
- 6966 64th St
- 6958 64th St
- 69-66 64th St