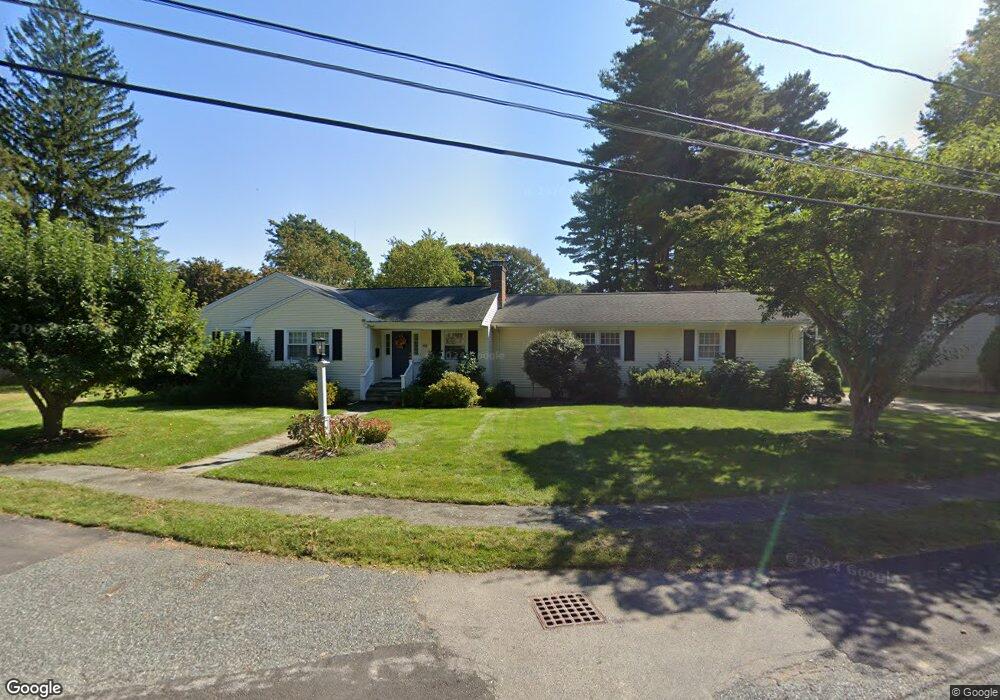
69 Bonwood Rd Needham, MA 02492
Estimated Value: $1,570,000 - $1,792,000
3
Beds
3
Baths
2,140
Sq Ft
$788/Sq Ft
Est. Value
About This Home
This home is located at 69 Bonwood Rd, Needham, MA 02492 and is currently estimated at $1,686,151, approximately $787 per square foot. 69 Bonwood Rd is a home located in Norfolk County with nearby schools including Newman Elementary School, High Rock Middle School, and Pollard Middle School.
Ownership History
Date
Name
Owned For
Owner Type
Purchase Details
Closed on
Jul 29, 2009
Sold by
Oconnor John F and Oconnor Mary M
Bought by
Buckley Kathleen M
Current Estimated Value
Home Financials for this Owner
Home Financials are based on the most recent Mortgage that was taken out on this home.
Original Mortgage
$350,000
Outstanding Balance
$230,749
Interest Rate
5.43%
Mortgage Type
Purchase Money Mortgage
Estimated Equity
$1,455,402
Purchase Details
Closed on
Apr 4, 2003
Sold by
Rothstein Ft and Rothstein
Bought by
Oconnor John F and Oconnor Mary M
Create a Home Valuation Report for This Property
The Home Valuation Report is an in-depth analysis detailing your home's value as well as a comparison with similar homes in the area
Home Values in the Area
Average Home Value in this Area
Purchase History
| Date | Buyer | Sale Price | Title Company |
|---|---|---|---|
| Buckley Kathleen M | $776,000 | -- | |
| Buckley Kathleen M | $776,000 | -- | |
| Oconnor John F | $500,000 | -- | |
| Oconnor John F | $500,000 | -- |
Source: Public Records
Mortgage History
| Date | Status | Borrower | Loan Amount |
|---|---|---|---|
| Open | Buckley Kathleen M | $350,000 | |
| Closed | Oconnor John F | $350,000 |
Source: Public Records
Tax History Compared to Growth
Tax History
| Year | Tax Paid | Tax Assessment Tax Assessment Total Assessment is a certain percentage of the fair market value that is determined by local assessors to be the total taxable value of land and additions on the property. | Land | Improvement |
|---|---|---|---|---|
| 2025 | $13,391 | $1,263,300 | $807,200 | $456,100 |
| 2024 | $12,109 | $967,200 | $511,600 | $455,600 |
| 2023 | $12,164 | $932,800 | $511,600 | $421,200 |
| 2022 | $11,684 | $873,900 | $470,000 | $403,900 |
| 2021 | $11,387 | $873,900 | $470,000 | $403,900 |
| 2020 | $11,114 | $889,800 | $470,000 | $419,800 |
| 2019 | $10,448 | $843,300 | $427,900 | $415,400 |
| 2018 | $10,018 | $843,300 | $427,900 | $415,400 |
| 2017 | $9,384 | $789,200 | $427,900 | $361,300 |
| 2016 | $9,154 | $793,200 | $427,900 | $365,300 |
| 2015 | $8,955 | $793,200 | $427,900 | $365,300 |
| 2014 | $9,559 | $821,200 | $373,000 | $448,200 |
Source: Public Records
Map
Nearby Homes
- 29 Tolman St
- 24 Deerfield Rd
- 361 High Rock St
- 287 High Rock St
- 37 Carleton Dr
- 30 Richardson Dr
- 47 Emerson Rd
- 71 School St
- 80 Emerson Rd
- 233 Warren St
- 154 Warren St
- 1 Windsor Rd
- 34 Pershing Rd
- 957 South St
- 1011 Webster St
- 1780 Central Ave
- 1266 South St
- 445 Hillside Ave
- 365 Charles River St
- 828 South St