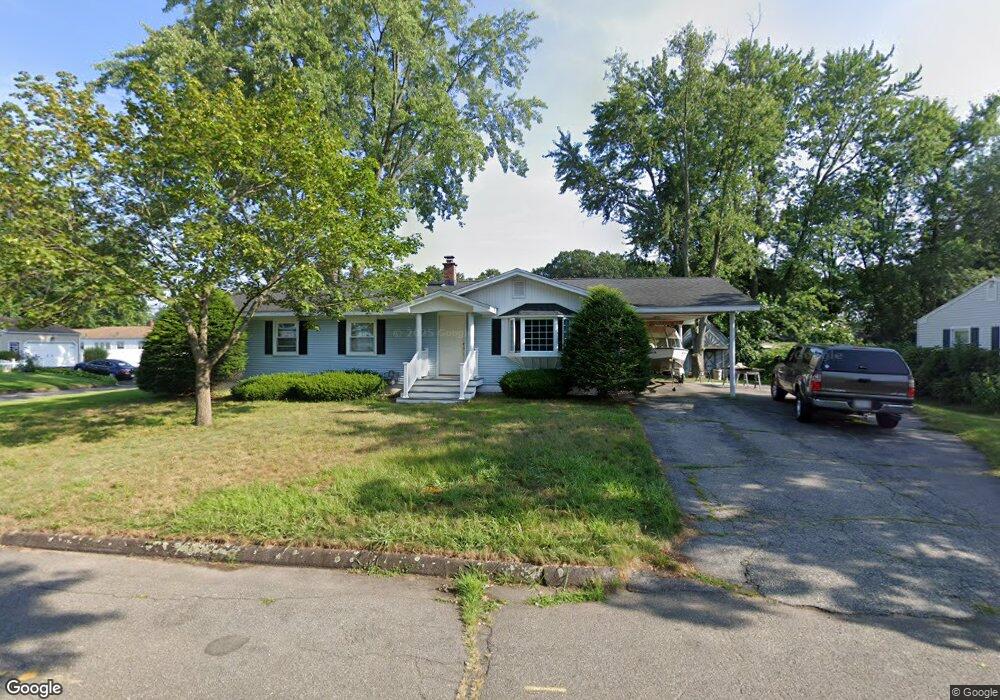
69 Daniel Dr Chicopee, MA 01013
Sandy Hill NeighborhoodEstimated Value: $281,000 - $342,000
3
Beds
2
Baths
1,248
Sq Ft
$249/Sq Ft
Est. Value
About This Home
This home is located at 69 Daniel Dr, Chicopee, MA 01013 and is currently estimated at $311,077, approximately $249 per square foot. 69 Daniel Dr is a home located in Hampden County with nearby schools including Barry Elementary School, Bellamy Middle School, and Chicopee High School.
Ownership History
Date
Name
Owned For
Owner Type
Purchase Details
Closed on
Oct 29, 2002
Sold by
Oliveira Mary G
Bought by
Oliveira Antero
Current Estimated Value
Home Financials for this Owner
Home Financials are based on the most recent Mortgage that was taken out on this home.
Original Mortgage
$98,000
Outstanding Balance
$40,818
Interest Rate
6.2%
Mortgage Type
Purchase Money Mortgage
Estimated Equity
$270,259
Create a Home Valuation Report for This Property
The Home Valuation Report is an in-depth analysis detailing your home's value as well as a comparison with similar homes in the area
Home Values in the Area
Average Home Value in this Area
Purchase History
| Date | Buyer | Sale Price | Title Company |
|---|---|---|---|
| Oliveira Antero | $60,000 | -- |
Source: Public Records
Mortgage History
| Date | Status | Borrower | Loan Amount |
|---|---|---|---|
| Open | Oliveira Antero | $98,000 | |
| Previous Owner | Oliveira Antero | $6,000 | |
| Previous Owner | Oliveira Antero | $15,536 | |
| Previous Owner | Oliveira Antero | $8,192 |
Source: Public Records
Tax History
| Year | Tax Paid | Tax Assessment Tax Assessment Total Assessment is a certain percentage of the fair market value that is determined by local assessors to be the total taxable value of land and additions on the property. | Land | Improvement |
|---|---|---|---|---|
| 2025 | $4,260 | $281,000 | $109,300 | $171,700 |
| 2024 | $4,043 | $273,900 | $107,100 | $166,800 |
| 2023 | $3,828 | $252,700 | $97,300 | $155,400 |
| 2022 | $3,666 | $215,800 | $84,600 | $131,200 |
| 2021 | $3,738 | $197,900 | $76,900 | $121,000 |
| 2020 | $3,359 | $192,400 | $79,000 | $113,400 |
| 2019 | $3,509 | $184,800 | $79,000 | $105,800 |
| 2018 | $3,367 | $177,200 | $75,300 | $101,900 |
| 2017 | $2,953 | $170,600 | $69,300 | $101,300 |
| 2016 | $2,831 | $167,400 | $69,300 | $98,100 |
| 2015 | $2,894 | $165,000 | $69,300 | $95,700 |
| 2014 | $1,447 | $165,000 | $69,300 | $95,700 |
Source: Public Records
Map
Nearby Homes
- 0 Nelson St
- 35 Lower Grape St
- 438 Front St
- 200 Lambert Terrace Unit 2
- 541 Grattan St
- 583 Mckinstry Ave
- 85 Orchard St
- 45 Hastings St
- 21 Depot St
- 269 Chicopee St Unit 6
- 219 Clarendon Ave
- 76 Joy St
- 26 Belcher St
- 51 Beaumont Ave
- 23 Jackson St
- 0 School St
- 439 Oldfield Rd
- 87 Blanchwood Ave
- 86 Beaumont Ave
- 35 Dublin St
Your Personal Tour Guide
Ask me questions while you tour the home.