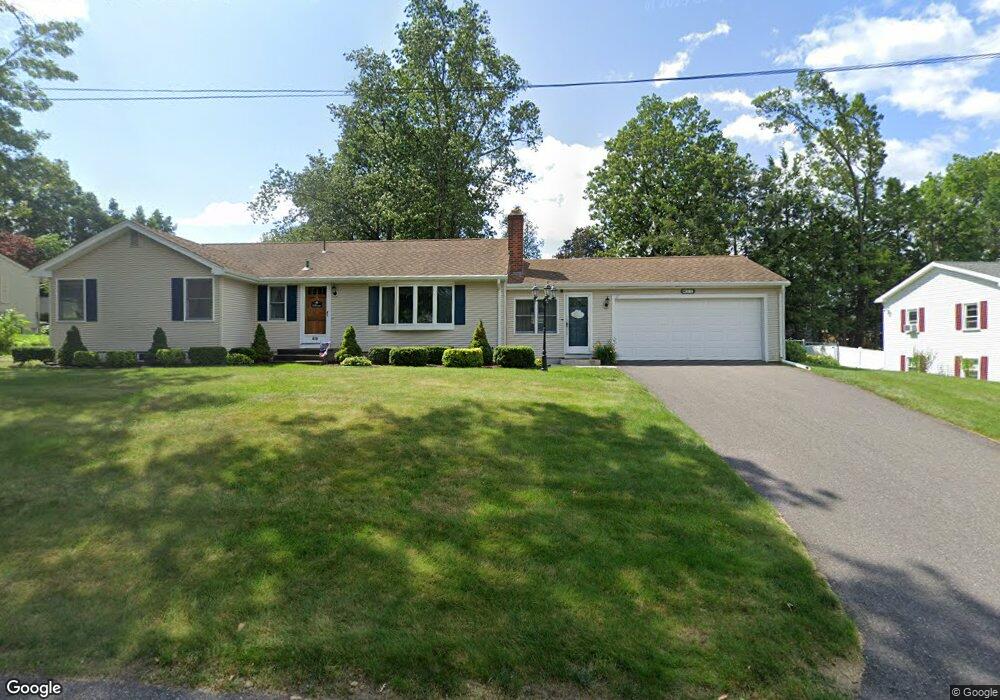
69 Lynebrook Rd Springfield, MA 01118
Sixteen Acres NeighborhoodEstimated Value: $367,822 - $430,000
3
Beds
2
Baths
1,684
Sq Ft
$237/Sq Ft
Est. Value
About This Home
This home is located at 69 Lynebrook Rd, Springfield, MA 01118 and is currently estimated at $399,706, approximately $237 per square foot. 69 Lynebrook Rd is a home located in Hampden County with nearby schools including Arthur T Talmadge Elementary School, M Marcus Kiley Middle, and Springfield High School of Science and Technology.
Ownership History
Date
Name
Owned For
Owner Type
Purchase Details
Closed on
Nov 15, 1989
Sold by
Pollak Charlotte K
Bought by
Goehlert Scott A
Current Estimated Value
Home Financials for this Owner
Home Financials are based on the most recent Mortgage that was taken out on this home.
Original Mortgage
$80,000
Interest Rate
9.97%
Mortgage Type
Purchase Money Mortgage
Create a Home Valuation Report for This Property
The Home Valuation Report is an in-depth analysis detailing your home's value as well as a comparison with similar homes in the area
Home Values in the Area
Average Home Value in this Area
Purchase History
| Date | Buyer | Sale Price | Title Company |
|---|---|---|---|
| Goehlert Scott A | $141,000 | -- |
Source: Public Records
Mortgage History
| Date | Status | Borrower | Loan Amount |
|---|---|---|---|
| Closed | Goehlert Scott A | $31,000 | |
| Closed | Goehlert Scott A | $59,900 | |
| Closed | Goehlert Scott A | $80,000 |
Source: Public Records
Tax History
| Year | Tax Paid | Tax Assessment Tax Assessment Total Assessment is a certain percentage of the fair market value that is determined by local assessors to be the total taxable value of land and additions on the property. | Land | Improvement |
|---|---|---|---|---|
| 2025 | $6,035 | $384,900 | $60,800 | $324,100 |
| 2024 | $6,154 | $383,200 | $60,800 | $322,400 |
| 2023 | $5,475 | $321,100 | $57,900 | $263,200 |
| 2022 | $5,230 | $277,900 | $61,200 | $216,700 |
| 2021 | $4,991 | $264,100 | $55,600 | $208,500 |
| 2020 | $4,906 | $251,200 | $55,600 | $195,600 |
| 2019 | $4,798 | $243,800 | $55,600 | $188,200 |
| 2018 | $4,479 | $227,600 | $55,600 | $172,000 |
| 2017 | $4,276 | $217,500 | $55,600 | $161,900 |
| 2016 | $4,123 | $209,700 | $55,600 | $154,100 |
| 2015 | $4,261 | $216,600 | $55,600 | $161,000 |
Source: Public Records
Map
Nearby Homes
- 86 Wildwood Ave
- 81 W Crystal Brook Dr
- 24 Wands St
- 120 Bridle Path Rd
- 85 Talmadge Dr
- 41 Hillside Dr
- 86 Talmadge Dr
- 25 Laurelwood Ln
- 55 Old Farm Rd
- 17 Pebble Mill Rd
- 55 Allen St
- 1962 Allen St
- 17 Skyridge Ln
- 101 Regal St
- 647 Plumtree Rd
- 228 Acrebrook Rd
- 19 Manor Ct Unit 19
- 73 Timber Ln
- 46 Puritan Cir
- 744 Bradley Rd
Your Personal Tour Guide
Ask me questions while you tour the home.