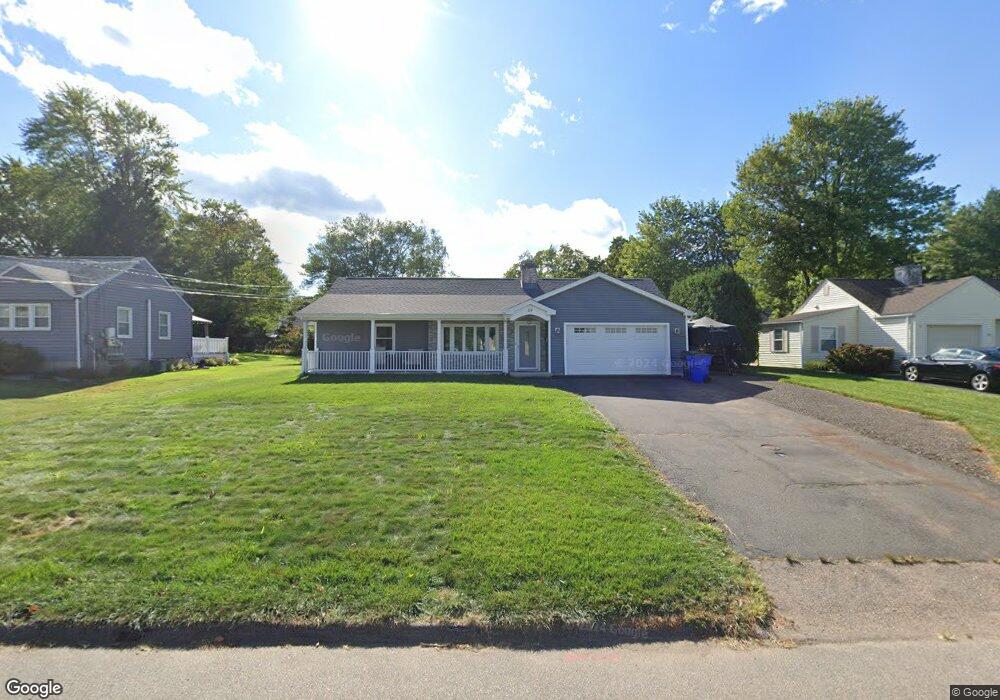
69 Olney Rd Wethersfield, CT 06109
Estimated Value: $372,000 - $459,966
3
Beds
2
Baths
2,094
Sq Ft
$203/Sq Ft
Est. Value
About This Home
This home is located at 69 Olney Rd, Wethersfield, CT 06109 and is currently estimated at $425,742, approximately $203 per square foot. 69 Olney Rd is a home located in Hartford County with nearby schools including Emerson-Williams School, Silas Deane Middle School, and Wethersfield High School.
Ownership History
Date
Name
Owned For
Owner Type
Purchase Details
Closed on
Apr 16, 2010
Sold by
Eroglu Abdulhadi and Eroglu Leyla Zidani
Bought by
Lloyd Eric and Godfrey Keri
Current Estimated Value
Home Financials for this Owner
Home Financials are based on the most recent Mortgage that was taken out on this home.
Original Mortgage
$213,676
Interest Rate
4.97%
Purchase Details
Closed on
May 21, 1999
Sold by
Hull Christina P
Bought by
Erogla Abdulhadi and Zidanc Leyla
Create a Home Valuation Report for This Property
The Home Valuation Report is an in-depth analysis detailing your home's value as well as a comparison with similar homes in the area
Home Values in the Area
Average Home Value in this Area
Purchase History
| Date | Buyer | Sale Price | Title Company |
|---|---|---|---|
| Lloyd Eric | $218,000 | -- | |
| Erogla Abdulhadi | $135,000 | -- |
Source: Public Records
Mortgage History
| Date | Status | Borrower | Loan Amount |
|---|---|---|---|
| Open | Erogla Abdulhadi | $192,600 | |
| Closed | Erogla Abdulhadi | $213,676 | |
| Previous Owner | Erogla Abdulhadi | $120,000 |
Source: Public Records
Tax History
| Year | Tax Paid | Tax Assessment Tax Assessment Total Assessment is a certain percentage of the fair market value that is determined by local assessors to be the total taxable value of land and additions on the property. | Land | Improvement |
|---|---|---|---|---|
| 2025 | $10,682 | $259,140 | $94,740 | $164,400 |
| 2024 | $7,275 | $168,320 | $73,500 | $94,820 |
| 2023 | $7,032 | $168,320 | $73,500 | $94,820 |
| 2022 | $6,498 | $158,170 | $73,500 | $84,670 |
| 2021 | $6,433 | $158,170 | $73,500 | $84,670 |
| 2020 | $6,436 | $158,170 | $73,500 | $84,670 |
| 2019 | $6,444 | $158,170 | $73,500 | $84,670 |
| 2018 | $6,464 | $158,500 | $71,500 | $87,000 |
| 2017 | $6,304 | $158,500 | $71,500 | $87,000 |
| 2016 | $6,109 | $158,500 | $71,500 | $87,000 |
| 2015 | $6,053 | $158,500 | $71,500 | $87,000 |
| 2014 | $5,823 | $158,500 | $71,500 | $87,000 |
Source: Public Records
Map
Nearby Homes
Your Personal Tour Guide
Ask me questions while you tour the home.