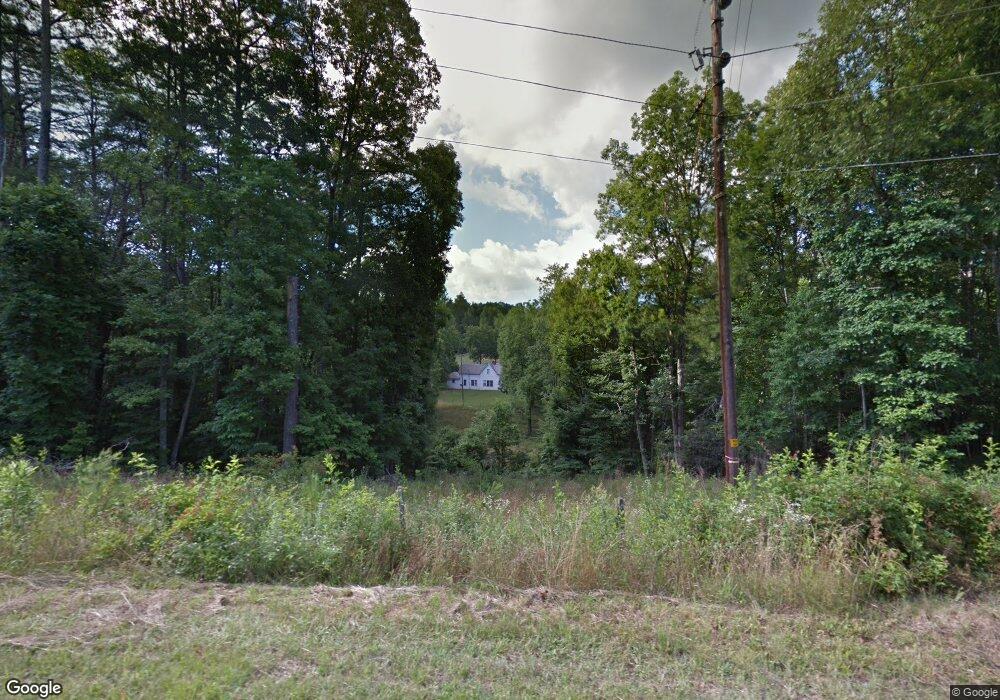
690 Star Creek Rd Morganton, GA 30560
Estimated Value: $536,000 - $650,000
--
Bed
--
Bath
2,632
Sq Ft
$230/Sq Ft
Est. Value
About This Home
This home is located at 690 Star Creek Rd, Morganton, GA 30560 and is currently estimated at $604,709, approximately $229 per square foot. 690 Star Creek Rd is a home with nearby schools including Fannin County High School.
Ownership History
Date
Name
Owned For
Owner Type
Purchase Details
Closed on
Sep 2, 2025
Sold by
Allen Joseph Wayne
Bought by
River In The Mountains Llc
Current Estimated Value
Purchase Details
Closed on
Jan 22, 2019
Sold by
Allen Shana K
Bought by
Star Creek Properties Llc
Purchase Details
Closed on
May 7, 2014
Sold by
Curbow Jay Dean
Bought by
Curbow Jay Dean and Allen Shana K
Purchase Details
Closed on
Oct 23, 2009
Sold by
Sims Curbow Margaret A
Bought by
Curbow Genevive K
Purchase Details
Closed on
Jan 2, 2009
Sold by
Curbow Beechie M
Bought by
Lance Properties Llc
Purchase Details
Closed on
Jul 10, 2001
Sold by
Lance Properties Llc
Bought by
Mccarter Bill D
Purchase Details
Closed on
Jan 30, 1991
Bought by
Mccarter Bill
Create a Home Valuation Report for This Property
The Home Valuation Report is an in-depth analysis detailing your home's value as well as a comparison with similar homes in the area
Home Values in the Area
Average Home Value in this Area
Purchase History
| Date | Buyer | Sale Price | Title Company |
|---|---|---|---|
| River In The Mountains Llc | -- | -- | |
| Star Creek Properties Llc | -- | -- | |
| Curbow Jay Dean | -- | -- | |
| Curbow Genevive K | -- | -- | |
| Curbow Genevive K | -- | -- | |
| Curbow Jay Dean | -- | -- | |
| Curbow Jay Dean | -- | -- | |
| Whyte Chelsey M | -- | -- | |
| Whyte Chelsey M | -- | -- | |
| Sims Curbow Margaret A | -- | -- | |
| Sims Curbow Margaret A | -- | -- | |
| Lance Properties Llc | -- | -- | |
| Mccarter Bill D | -- | -- | |
| Mccarter Bill | -- | -- |
Source: Public Records
Tax History Compared to Growth
Tax History
| Year | Tax Paid | Tax Assessment Tax Assessment Total Assessment is a certain percentage of the fair market value that is determined by local assessors to be the total taxable value of land and additions on the property. | Land | Improvement |
|---|---|---|---|---|
| 2025 | $1,104 | $214,844 | $113,293 | $101,551 |
| 2024 | $1,104 | $214,843 | $113,292 | $101,551 |
| 2023 | $1,034 | $196,220 | $113,292 | $82,928 |
| 2022 | $1,030 | $196,220 | $113,292 | $82,928 |
| 2021 | $1,070 | $171,802 | $113,292 | $58,510 |
| 2020 | $1,084 | $171,802 | $113,292 | $58,510 |
| 2019 | $1,110 | $171,802 | $113,292 | $58,510 |
| 2018 | $806 | $94,010 | $56,306 | $37,704 |
| 2017 | $1,672 | $94,509 | $56,306 | $38,203 |
| 2016 | $749 | $89,345 | $56,306 | $33,039 |
| 2015 | $593 | $75,826 | $56,306 | $19,520 |
| 2014 | $1,299 | $72,996 | $52,338 | $20,658 |
| 2013 | -- | $67,314 | $52,337 | $14,976 |
Source: Public Records
Map
Nearby Homes
- 80 Tall Pines Rd
- 0 Rd
- 0 Lower Star Creek (Tract A-10 67 Acres) Rd
- 14576 Morganton Hwy
- 365 Lower Star Creek Rd
- 191 Barker Ln
- 721 Lower Star Creek Rd
- 211 Highland Forest Dr
- 161 Old Dial Rd
- 362 Old Dial Rd
- 2.24 AC Lower Star Creek Rd
- 6.4 Acre Collins Rd
- 280 Star Creek Crossing
- Lot 14 Fairview Way
- Lot 188 The Ridges
- 173 Southern Cross Ct
- 128 Overlake Ct
- 4 Mountain Rd
- 8 Mountain Rd
- 22 Fairview Dr
- 789 Star Creek Rd
- 663 Carter Mill Rd
- 936 Star Creek Rd
- 585 Star Creek Rd
- 544 Barrks Farm Rd
- 452 Barrks Farm Rd
- 435 Barrks Farm Rd
- 486 Barrks Farm Rd
- 1023 Star Creek Rd
- 454 Carter Mill Rd
- 0 Barrks Farm Unit 297104
- 955 Star Creek Rd
- 601 Carter Mill Rd
- 1032 Richards Branch Rd
- 80 Tall Pines Rd
- 260 Star Creek Dr
- 106 Tall Pines Rd
- 1032 Star Creek Rd
- 316 Star Creek Rd
- 935 Star Creek Rd