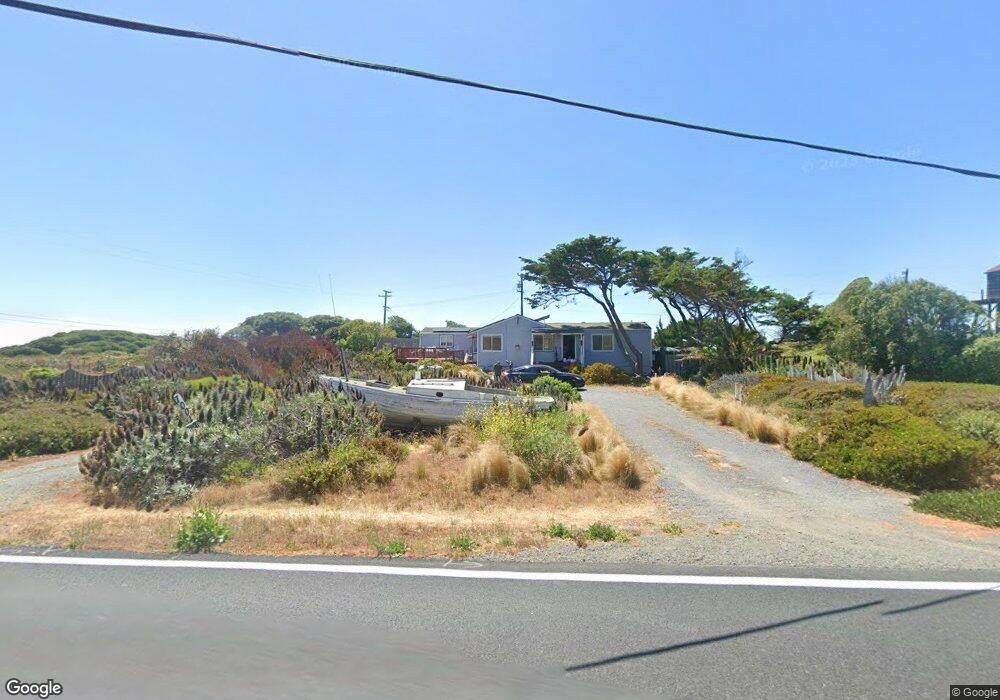
6942 Cliff Ave Bodega Bay, CA 94923
Estimated Value: $989,023 - $1,160,000
2
Beds
1
Bath
1,248
Sq Ft
$872/Sq Ft
Est. Value
About This Home
This home is located at 6942 Cliff Ave, Bodega Bay, CA 94923 and is currently estimated at $1,088,506, approximately $872 per square foot. 6942 Cliff Ave is a home located in Sonoma County with nearby schools including Bodega Bay Elementary School and Tomales High School.
Ownership History
Date
Name
Owned For
Owner Type
Purchase Details
Closed on
Jan 13, 2017
Sold by
Charter Richard
Bought by
Charter Richard A and Castellblanch Marilyn V
Current Estimated Value
Purchase Details
Closed on
Nov 4, 2015
Sold by
Castellblanch Marilyn V
Bought by
Charter Richard
Home Financials for this Owner
Home Financials are based on the most recent Mortgage that was taken out on this home.
Original Mortgage
$359,000
Outstanding Balance
$282,467
Interest Rate
3.8%
Mortgage Type
New Conventional
Estimated Equity
$806,039
Purchase Details
Closed on
Mar 1, 2000
Sold by
Castellblanch Marilyn
Bought by
Charter Richard
Home Financials for this Owner
Home Financials are based on the most recent Mortgage that was taken out on this home.
Original Mortgage
$252,700
Interest Rate
8.27%
Purchase Details
Closed on
Jun 16, 1994
Sold by
Dye Donald E and Dye Suzanne M
Bought by
Dye Donald E and Dye Suzanne M
Create a Home Valuation Report for This Property
The Home Valuation Report is an in-depth analysis detailing your home's value as well as a comparison with similar homes in the area
Purchase History
| Date | Buyer | Sale Price | Title Company |
|---|---|---|---|
| Charter Richard A | -- | None Available | |
| Charter Richard | -- | First American Title Company | |
| Charter Richard | -- | North American Title Co | |
| Charter Richard | $370,000 | North American Title Co | |
| Dye Donald E | -- | -- |
Source: Public Records
Mortgage History
| Date | Status | Borrower | Loan Amount |
|---|---|---|---|
| Open | Charter Richard | $359,000 | |
| Closed | Charter Richard | $252,700 |
Source: Public Records
Tax History
| Year | Tax Paid | Tax Assessment Tax Assessment Total Assessment is a certain percentage of the fair market value that is determined by local assessors to be the total taxable value of land and additions on the property. | Land | Improvement |
|---|---|---|---|---|
| 2025 | $6,505 | $568,677 | $184,431 | $384,246 |
| 2024 | $6,505 | $557,527 | $180,815 | $376,712 |
| 2023 | $6,505 | $546,596 | $177,270 | $369,326 |
| 2022 | $6,313 | $535,880 | $173,795 | $362,085 |
| 2021 | $6,566 | $525,374 | $170,388 | $354,986 |
| 2020 | $6,583 | $519,988 | $168,641 | $351,347 |
| 2019 | $6,518 | $509,793 | $165,335 | $344,458 |
| 2018 | $6,405 | $499,798 | $162,094 | $337,704 |
| 2017 | $6,259 | $489,999 | $158,916 | $331,083 |
| 2016 | $6,163 | $480,392 | $155,800 | $324,592 |
| 2015 | -- | $473,177 | $153,460 | $319,717 |
| 2014 | -- | $463,909 | $150,454 | $313,455 |
Source: Public Records
Map
Nearby Homes
- 6175 N Highway 1
- 317 Los Santos Dr
- 225 Los Santos Dr
- 4894 Coastal Ave
- 145 Bean Ave
- 415 Mcchristian Ave
- 21165 Hummingbird Ct
- 2490 California 1
- 2020 Sandpiper Ct
- 1534 Ranch Rd
- 1235 Bay View St
- 140 Kent Ave
- 153 Harbor View Way
- 22776 Moscow Rd
- 22900 Sylvan Way Unit F
- 925 Cazadero Hwy
- 1513 Sea Way
- 1536 Sea Way
- 2025 Dubloon Ct
- 150 Cypress Loop
- 6959 Cliff Ave
- 6953 Cliff Ave
- 7001 N Highway 1
- 7001 N Highway 1 Unkn
- 6947 Cliff Ave
- 6967 Cliff Ave
- 6987 Cliff Ave
- 6999 Cliff Ave
- 7007 Cliff Ave
- 6988 Cliff Ave
- 7005 Cliff Ave
- 7024 Cliff Ave
- 7015 Cliff Ave
- 7021 Cliff Ave
- 7036 Cliff Ave
- 7045 Cliff Ave
- 7048 Cliff Ave
- 7060 Cliff Ave
- 7063 Cliff Ave
- 7075 Cliff Ave
Your Personal Tour Guide
Ask me questions while you tour the home.