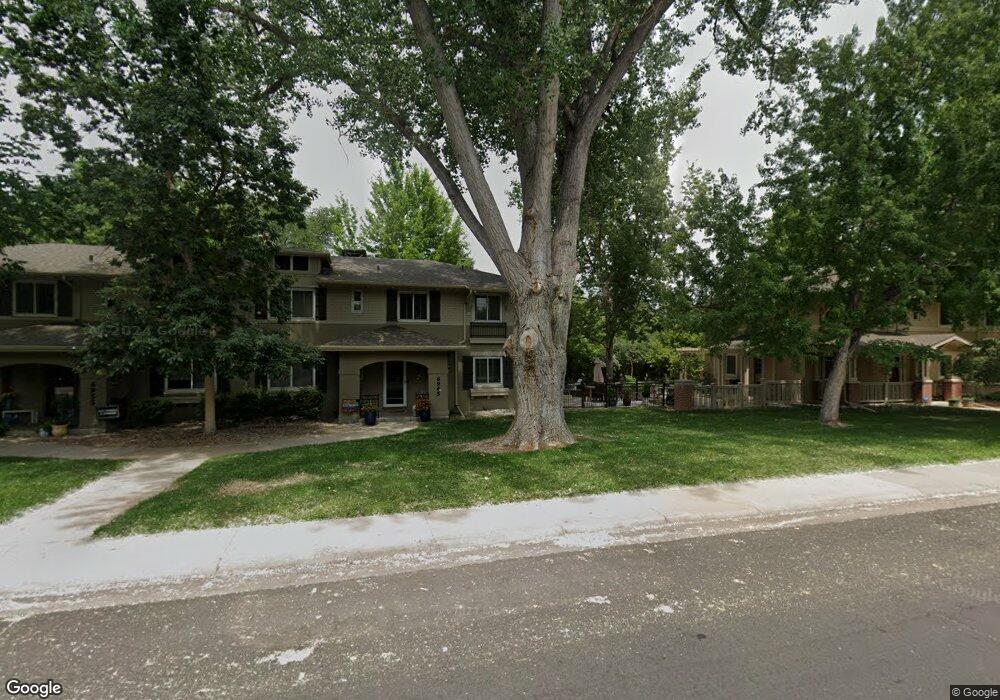
6965 E 3rd Ave Denver, CO 80220
Lowry NeighborhoodEstimated Value: $574,662 - $663,000
4
Beds
2
Baths
1,846
Sq Ft
$331/Sq Ft
Est. Value
About This Home
This home is located at 6965 E 3rd Ave, Denver, CO 80220 and is currently estimated at $610,166, approximately $330 per square foot. 6965 E 3rd Ave is a home located in Denver County with nearby schools including Lowry Elementary School, Hill Campus of Arts & Sciences, and George Washington High School.
Ownership History
Date
Name
Owned For
Owner Type
Purchase Details
Closed on
Aug 17, 2012
Sold by
Steele Robert M and Steele Carol S
Bought by
Nelson Craig A and Steele Melissa J
Current Estimated Value
Home Financials for this Owner
Home Financials are based on the most recent Mortgage that was taken out on this home.
Original Mortgage
$255,290
Outstanding Balance
$174,995
Interest Rate
3.75%
Mortgage Type
FHA
Estimated Equity
$435,171
Purchase Details
Closed on
Jun 29, 2006
Sold by
Breit Marshall C and Breit Marsha S
Bought by
Steele Robert M and Steele Carol S
Home Financials for this Owner
Home Financials are based on the most recent Mortgage that was taken out on this home.
Original Mortgage
$250,000
Interest Rate
6.63%
Mortgage Type
Purchase Money Mortgage
Purchase Details
Closed on
Jun 28, 2004
Sold by
Lowry Economic Redevelopment Authority
Bought by
Breit Marshall C and Breit Marsha S
Create a Home Valuation Report for This Property
The Home Valuation Report is an in-depth analysis detailing your home's value as well as a comparison with similar homes in the area
Home Values in the Area
Average Home Value in this Area
Purchase History
| Date | Buyer | Sale Price | Title Company |
|---|---|---|---|
| Nelson Craig A | $260,000 | None Available | |
| Steele Robert M | $321,000 | Land Title Guarantee Company | |
| Breit Marshall C | $249,500 | Land Title Guarantee Company |
Source: Public Records
Mortgage History
| Date | Status | Borrower | Loan Amount |
|---|---|---|---|
| Open | Nelson Craig A | $255,290 | |
| Previous Owner | Steele Robert M | $250,000 |
Source: Public Records
Tax History
| Year | Tax Paid | Tax Assessment Tax Assessment Total Assessment is a certain percentage of the fair market value that is determined by local assessors to be the total taxable value of land and additions on the property. | Land | Improvement |
|---|---|---|---|---|
| 2025 | $2,720 | $40,070 | $14,060 | $14,060 |
| 2024 | $2,720 | $34,340 | $9,680 | $24,660 |
| 2023 | $2,661 | $34,340 | $9,680 | $24,660 |
| 2022 | $2,398 | $30,150 | $10,790 | $19,360 |
| 2021 | $2,315 | $31,020 | $11,100 | $19,920 |
| 2020 | $2,105 | $28,370 | $11,100 | $17,270 |
| 2019 | $2,046 | $28,370 | $11,100 | $17,270 |
| 2018 | $1,956 | $25,280 | $9,580 | $15,700 |
| 2017 | $1,950 | $25,280 | $9,580 | $15,700 |
| 2016 | $2,199 | $26,960 | $10,587 | $16,373 |
| 2015 | $2,106 | $26,960 | $10,587 | $16,373 |
| 2014 | $1,772 | $21,330 | $7,339 | $13,991 |
Source: Public Records
Map
Nearby Homes
- 431 Poplar St
- 300 Oneida St
- 253 Oneida Ct
- 475 Olive St
- 7134 E 6th Avenue Pkwy
- 160 Poplar St Unit A
- 159 Quebec St Unit D
- 159 Quebec St Unit B
- 209 Quebec St Unit L
- 230 Poplar St Unit G
- 211 Magnolia St
- 7030 E 7th Ave
- 7450 E 6th Ave
- 6971 E Lowry Blvd
- 732 Poplar St
- 463 Locust St
- 477 Locust St
- 7680 E 6th Ave
- 6830 E Lowry Blvd
- 6820 E Lowry Blvd
Your Personal Tour Guide
Ask me questions while you tour the home.