


6972 S 300 W Pendleton, IN 46064
Estimated payment $6,947/month
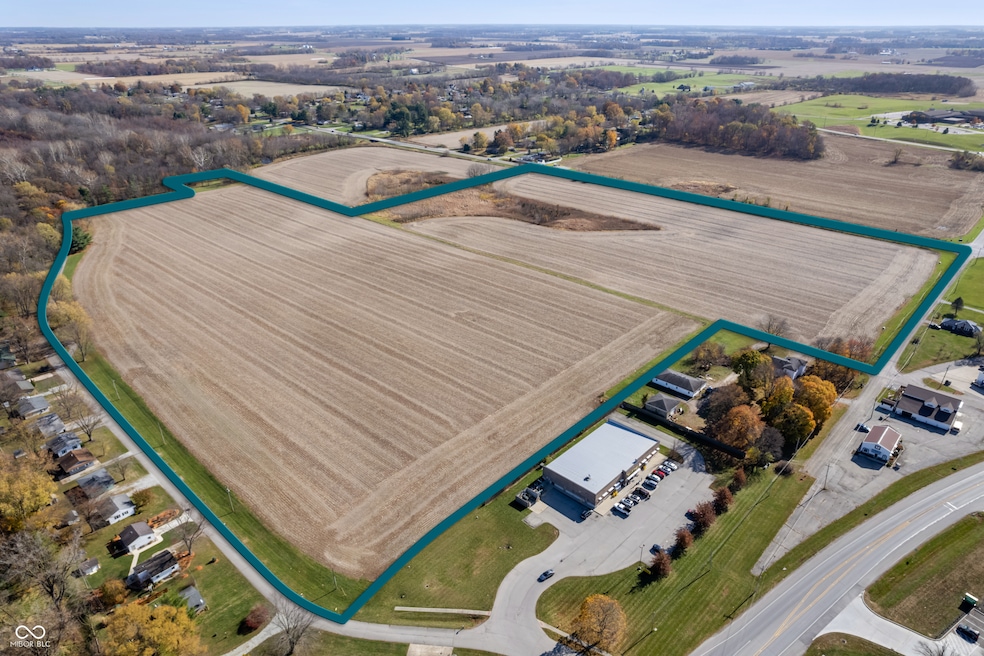
About This Lot
50+ acres of farmland located in the heart of Pendleton, IN.

Property Details
Property Type
- Land
Est. Annual Taxes
- $7,624
Lot Details
- 42.17 Acre Lot
- Additional Parcels
Community Details
- No Home Owners Association
Listing and Financial Details
- Tax Lot 48-14-15-900-001.001-013
- Assessor Parcel Number 481415900001001013
Map
Home Values in the Area
Average Home Value in this Area
Tax History
| Year | Tax Paid | Tax Assessment Tax Assessment Total Assessment is a certain percentage of the fair market value that is determined by local assessors to be the total taxable value of land and additions on the property. | Land | Improvement |
|---|---|---|---|---|
| 2025 | $8,340 | $422,300 | $175,300 | $247,000 |
| 2024 | $8,340 | $417,000 | $181,300 | $235,700 |
| 2023 | $7,624 | $377,000 | $162,400 | $214,600 |
| 2022 | $6,914 | $343,400 | $143,000 | $200,400 |
| 2021 | $6,390 | $317,300 | $135,200 | $182,100 |
| 2020 | $6,401 | $310,900 | $129,900 | $181,000 |
| 2019 | $9,970 | $329,800 | $140,400 | $189,400 |
| 2018 | $8,748 | $297,100 | $136,300 | $160,800 |
| 2017 | $4,977 | $245,600 | $87,200 | $158,400 |
| 2016 | $4,867 | $240,200 | $85,800 | $154,400 |
| 2014 | $4,655 | $227,800 | $79,400 | $148,400 |
Property History
| Date | Event | Price | List to Sale | Price per Sq Ft |
|---|---|---|---|---|
| 09/03/2025 09/03/25 | For Sale | $1,200,000 | 0.0% | -- |
| 11/12/2024 11/12/24 | Pending | -- | -- | -- |
| 11/12/2024 11/12/24 | For Sale | $1,200,000 | -- | -- |
Purchase History
| Date | Type | Sale Price | Title Company |
|---|---|---|---|
| Personal Reps Deed | -- | None Listed On Document | |
| Quit Claim Deed | -- | -- | |
| Quit Claim Deed | -- | -- |
Source: MIBOR Broker Listing Cooperative®
MLS Number: 22010997
APN: 48-14-15-900-001.001-013
Disclaimer: Certain information contained herein is derived from information provided by parties other than Homes.com. All information provided is deemed reliable, but is not guaranteed to be accurate and should be independently verified.
![]() Based on information submitted to the MLS GRID. All data is obtained from various sources and may not have been verified by broker or MLS GRID. Supplied Open House Information is subject to change without notice. All information should be independently reviewed and verified for accuracy. Properties may or may not be listed by the office/agent presenting the information. Some IDX listings have been excluded from this website.
Based on information submitted to the MLS GRID. All data is obtained from various sources and may not have been verified by broker or MLS GRID. Supplied Open House Information is subject to change without notice. All information should be independently reviewed and verified for accuracy. Properties may or may not be listed by the office/agent presenting the information. Some IDX listings have been excluded from this website.
Based on information submitted to the MLS GRID
- 3006 Huntsville Rd
- 400 E Water St
- 1000 East St
- 201 N East St
- 460 E Madison Ave
- 110 W Water St
- 8545 Strabet Dr
- 315 W High St
- 720 S Broadway St
- 621 S Silver St
- 2730 Woodlawn Dr
- 291 Limerick Ln
- 140 Waterford Ct
- 513 W State St
- 224 Waterford Ln
- 2211 W 600 S
- 227 Jefferson St
- 928 S Broadway St
- 238 Jefferson St
- 8329 S 300 W
- 231 N John St
- 291 Limerick Ln
- 354 Limerick Ln
- 8266 Juniper Ln
- 524 W 53rd St
- 524 W 53rd St
- 4325 S Madison Ave
- 1326 Mcintosh Ln
- 3634 Oaklawn Dr
- 10856 Grace Dr
- 7587 Charlotte Dr
- 10892 Woods Dr
- 9050 800 S
- 7841 Rose Ln
- 924 Sun Valley Dr
- 3121 Jefferson St
- 3119 Jefferson St
- 2710 Fletcher St
- 2439 Chase St
- 1716 Drexel Dr
Ask me questions while you tour the home.