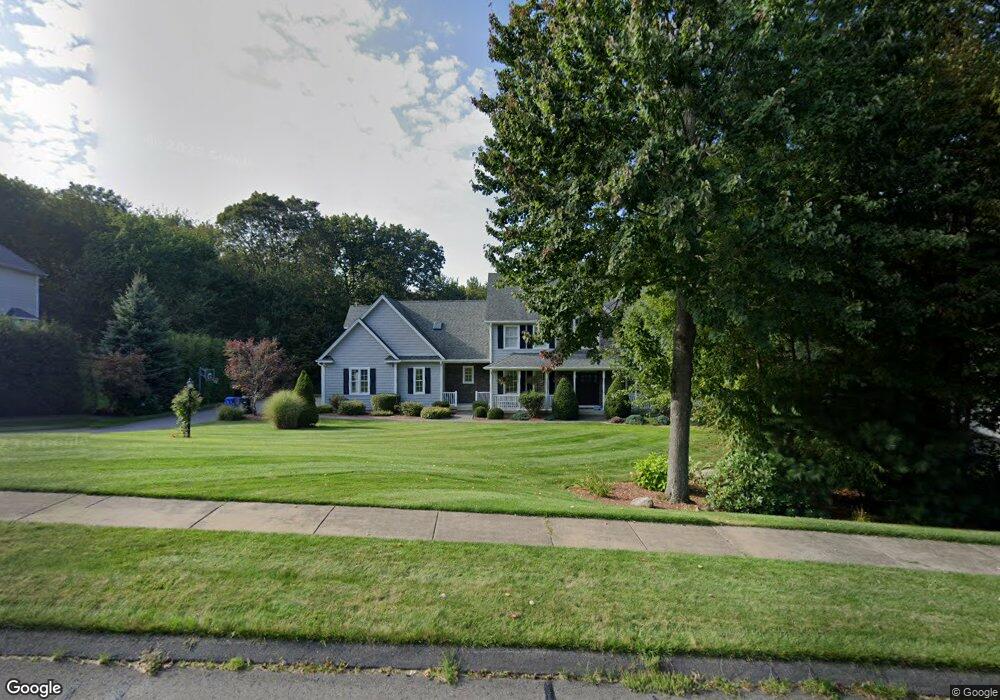
7 Azalea Ln Ellington, CT 06029
Crystal Lake NeighborhoodEstimated Value: $772,000 - $892,000
4
Beds
3
Baths
3,499
Sq Ft
$237/Sq Ft
Est. Value
About This Home
This home is located at 7 Azalea Ln, Ellington, CT 06029 and is currently estimated at $829,483, approximately $237 per square foot. 7 Azalea Ln is a home located in Tolland County with nearby schools including Ellington High School.
Ownership History
Date
Name
Owned For
Owner Type
Purchase Details
Closed on
Feb 28, 2025
Sold by
Smith Mark P and Smith Rebecca A
Bought by
Kupiec Frank M and Kupiec Catherine J
Current Estimated Value
Home Financials for this Owner
Home Financials are based on the most recent Mortgage that was taken out on this home.
Original Mortgage
$300,000
Outstanding Balance
$298,515
Interest Rate
7.04%
Mortgage Type
Purchase Money Mortgage
Estimated Equity
$530,968
Purchase Details
Closed on
Jul 1, 2010
Sold by
Rocha Brian and Rocha Carole
Bought by
Smith Mark and Smith Rebecca
Home Financials for this Owner
Home Financials are based on the most recent Mortgage that was taken out on this home.
Original Mortgage
$449,900
Interest Rate
4.87%
Mortgage Type
FHA
Purchase Details
Closed on
Oct 4, 2005
Sold by
Improveme Genovesis Hm
Bought by
Rocha Brian and Rocha Carole
Purchase Details
Closed on
Jul 28, 2005
Sold by
Crystal Ridge Ests
Bought by
Improveme Genovesis Hm
Create a Home Valuation Report for This Property
The Home Valuation Report is an in-depth analysis detailing your home's value as well as a comparison with similar homes in the area
Home Values in the Area
Average Home Value in this Area
Purchase History
| Date | Buyer | Sale Price | Title Company |
|---|---|---|---|
| Kupiec Frank M | $800,000 | None Available | |
| Kupiec Frank M | $800,000 | None Available | |
| Smith Mark | $462,500 | -- | |
| Smith Mark | $462,500 | -- | |
| Rocha Brian | $487,515 | -- | |
| Rocha Brian | $487,515 | -- | |
| Improveme Genovesis Hm | $250,000 | -- |
Source: Public Records
Mortgage History
| Date | Status | Borrower | Loan Amount |
|---|---|---|---|
| Open | Kupiec Frank M | $300,000 | |
| Closed | Kupiec Frank M | $300,000 | |
| Previous Owner | Improveme Genovesis Hm | $380,000 | |
| Previous Owner | Improveme Genovesis Hm | $449,900 |
Source: Public Records
Tax History Compared to Growth
Tax History
| Year | Tax Paid | Tax Assessment Tax Assessment Total Assessment is a certain percentage of the fair market value that is determined by local assessors to be the total taxable value of land and additions on the property. | Land | Improvement |
|---|---|---|---|---|
| 2025 | $12,909 | $347,940 | $69,920 | $278,020 |
| 2024 | $12,526 | $347,940 | $69,920 | $278,020 |
| 2023 | $11,934 | $347,940 | $69,920 | $278,020 |
| 2022 | $11,308 | $347,940 | $69,920 | $278,020 |
| 2021 | $10,995 | $347,940 | $69,920 | $278,020 |
| 2020 | $13,061 | $400,640 | $71,290 | $329,350 |
| 2019 | $13,061 | $400,640 | $71,290 | $329,350 |
| 2016 | $11,516 | $377,570 | $71,290 | $306,280 |
| 2015 | $10,801 | $354,140 | $71,290 | $282,850 |
| 2014 | $10,024 | $349,260 | $71,290 | $277,970 |
Source: Public Records
Map
Nearby Homes
- 127 Sandy Beach Rd
- 100 Wildwood Rd
- 42 Ladd Rd
- 26 Green St
- 267 Sandy Beach Rd
- 15 Usher Ridge
- 68 Usher Ridge
- 36 Usher Ridge
- 110 Neff Hill Rd
- 130 Neff Hill Rd
- 105 Neff Hill Rd
- 137 Neff Hill Rd
- 100 Neff Hill Rd
- 77 Neff Hill Rd
- 84 Neff Hill Rd
- 71 Neff Hill Rd
- 8 Neff Hill Rd
- 644 Buff Cap Rd
- 745 Old Stafford Rd
- 115 Conklin Rd
- 5 Azalea Ln
- 9 Azalea Ln
- 10 Azalea Ln
- 3 Azalea Ln
- 11 Azalea Ln
- 8 Azalea Ln
- 4 Azalea Ln
- 6 Azalea Ln
- 1 Azalea Ln
- 2 Azalea Ln
- 53 Crystal Ridge Dr
- 11 Boulder Ridge Dr
- 61 Crystal Ridge Dr (Lot #47)
- 10 Boulder Ridge Dr
- 56 Crystal Ridge Dr
- 61 Crystal Ridge Dr
- 51 Crystal Ridge Dr
- 9 Boulder Ridge Dr
- 54 Crystal Ridge Dr
- 63 Crystal Ridge Dr