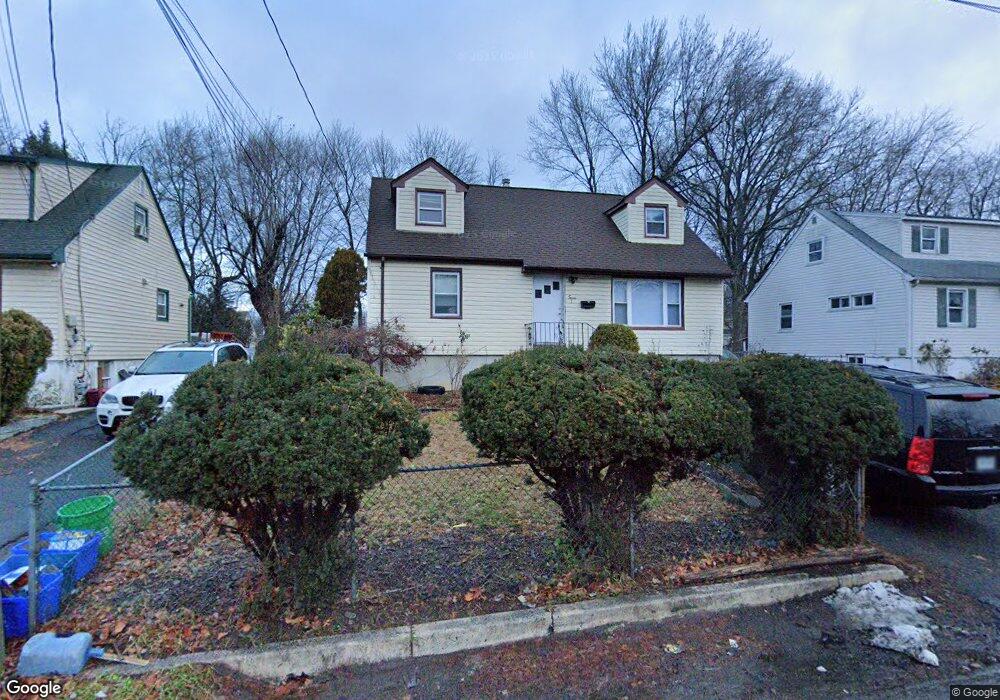
7 E Hickory St Spring Valley, NY 10977
Estimated Value: $585,000 - $832,988
4
Beds
2
Baths
1,532
Sq Ft
$493/Sq Ft
Est. Value
About This Home
This home is located at 7 E Hickory St, Spring Valley, NY 10977 and is currently estimated at $755,497, approximately $493 per square foot. 7 E Hickory St is a home located in Rockland County with nearby schools including Summit Park Elementary School, Pomona Middle School, and Ramapo High School.
Ownership History
Date
Name
Owned For
Owner Type
Purchase Details
Closed on
Jan 7, 2025
Sold by
Scarlett Linton
Bought by
Scarlett Claudia and Scarlett Repalma
Current Estimated Value
Home Financials for this Owner
Home Financials are based on the most recent Mortgage that was taken out on this home.
Original Mortgage
$340,000
Outstanding Balance
$336,963
Interest Rate
6.69%
Mortgage Type
New Conventional
Estimated Equity
$418,534
Purchase Details
Closed on
Jan 30, 2004
Sold by
Scarlett Repalma and Scarlett Linton
Bought by
Scarlett Linton
Home Financials for this Owner
Home Financials are based on the most recent Mortgage that was taken out on this home.
Original Mortgage
$270,000
Interest Rate
5.4%
Mortgage Type
New Conventional
Create a Home Valuation Report for This Property
The Home Valuation Report is an in-depth analysis detailing your home's value as well as a comparison with similar homes in the area
Home Values in the Area
Average Home Value in this Area
Purchase History
| Date | Buyer | Sale Price | Title Company |
|---|---|---|---|
| Scarlett Claudia | $600,000 | None Available | |
| Scarlett Claudia | $600,000 | None Available | |
| Scarlett Linton | -- | -- | |
| Scarlett Linton | -- | -- | |
| Scarlett Linton | -- | -- | |
| Scarlett Linton | -- | -- |
Source: Public Records
Mortgage History
| Date | Status | Borrower | Loan Amount |
|---|---|---|---|
| Open | Scarlett Claudia | $340,000 | |
| Closed | Scarlett Claudia | $340,000 | |
| Previous Owner | Scarlett Linton | $270,000 |
Source: Public Records
Tax History
| Year | Tax Paid | Tax Assessment Tax Assessment Total Assessment is a certain percentage of the fair market value that is determined by local assessors to be the total taxable value of land and additions on the property. | Land | Improvement |
|---|---|---|---|---|
| 2024 | $10,760 | $44,000 | $12,000 | $32,000 |
| 2023 | $10,760 | $44,000 | $12,000 | $32,000 |
| 2022 | $10,226 | $44,000 | $12,000 | $32,000 |
| 2021 | $10,226 | $44,000 | $12,000 | $32,000 |
| 2020 | $10,749 | $44,000 | $12,000 | $32,000 |
| 2019 | $11,276 | $44,000 | $12,000 | $32,000 |
| 2018 | $11,276 | $46,500 | $12,000 | $34,500 |
| 2017 | $11,397 | $46,500 | $12,000 | $34,500 |
| 2016 | $11,345 | $46,500 | $12,000 | $34,500 |
| 2015 | -- | $46,500 | $12,000 | $34,500 |
| 2014 | -- | $46,500 | $12,000 | $34,500 |
Source: Public Records
Map
Nearby Homes
- 9 E Hickory St
- 258 N Main St Unit C19
- 97 E Eckerson Rd
- 250 N Main St Unit F5
- 19 Sneden Place W Unit 19
- 17 Sneden Place W
- 313 N Main St
- 15 Pauline Ct
- 79 Creekside Cir
- 10 Bird Place Unit 10A
- 80 Sneden Place Unit 80
- 12 Bird Place Unit 18
- 12 Sherman Dr Unit 202
- 7 S Oak St
- 138 E Eckerson Rd
- 194 Sneden Place W Unit 194
- 196 Sneden Place W Unit 196
- 10 Northbrook Rd
- 6 Milla Ln
- 205 Sneden Place W Unit 205
Your Personal Tour Guide
Ask me questions while you tour the home.