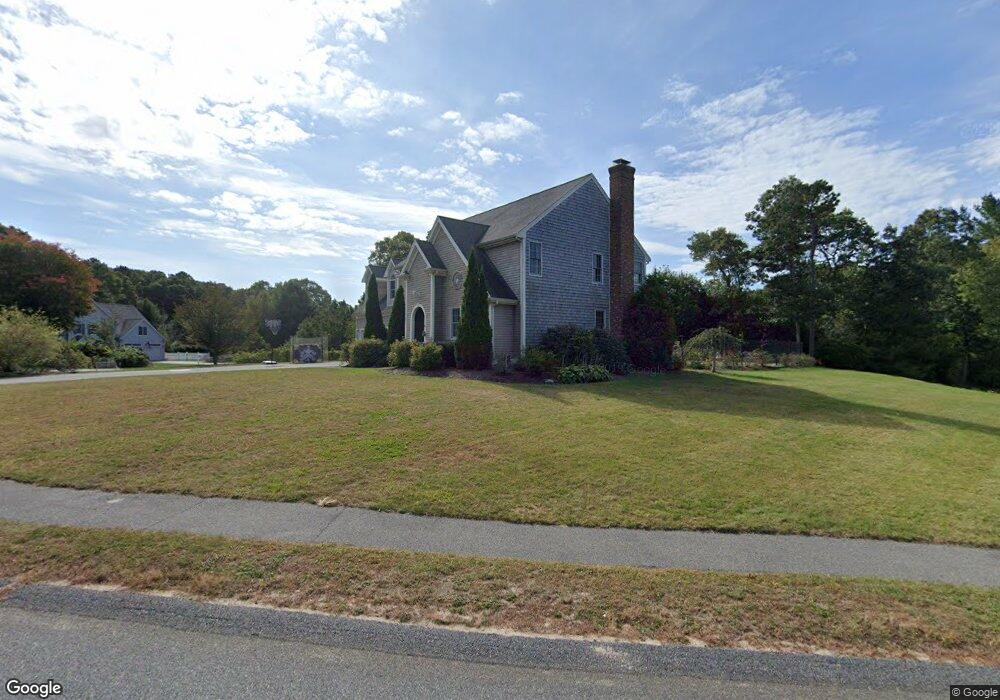
7 Tiffany Rd Bourne, MA 2532
Monument Beach NeighborhoodEstimated Value: $757,000 - $875,000
4
Beds
3
Baths
2,388
Sq Ft
$347/Sq Ft
Est. Value
About This Home
This home is located at 7 Tiffany Rd, Bourne, MA 2532 and is currently estimated at $828,161, approximately $346 per square foot. 7 Tiffany Rd is a home located in Barnstable County with nearby schools including Bourne High School, Cadence Academy Preschool - Bourne, and St Margaret Regional School.
Ownership History
Date
Name
Owned For
Owner Type
Purchase Details
Closed on
Aug 23, 2013
Sold by
Ducasse 4Th George A and Ducasse Rebekah S
Bought by
Thomas Joel P and Thomas Katie A
Current Estimated Value
Home Financials for this Owner
Home Financials are based on the most recent Mortgage that was taken out on this home.
Original Mortgage
$371,970
Outstanding Balance
$271,390
Interest Rate
4%
Mortgage Type
New Conventional
Estimated Equity
$556,771
Purchase Details
Closed on
Aug 29, 2003
Sold by
Old Centre Homes Inc
Bought by
Ducasse George A and Ducasse Rebekah S
Home Financials for this Owner
Home Financials are based on the most recent Mortgage that was taken out on this home.
Original Mortgage
$361,100
Interest Rate
5.69%
Mortgage Type
Purchase Money Mortgage
Create a Home Valuation Report for This Property
The Home Valuation Report is an in-depth analysis detailing your home's value as well as a comparison with similar homes in the area
Home Values in the Area
Average Home Value in this Area
Purchase History
| Date | Buyer | Sale Price | Title Company |
|---|---|---|---|
| Thomas Joel P | $413,300 | -- | |
| Thomas Joel P | $413,300 | -- | |
| Thomas Joel P | $413,300 | -- | |
| Ducasse George A | $462,900 | -- | |
| Ducasse George A | $462,900 | -- |
Source: Public Records
Mortgage History
| Date | Status | Borrower | Loan Amount |
|---|---|---|---|
| Open | Thomas Joel P | $371,970 | |
| Closed | Thomas Joel P | $371,970 | |
| Previous Owner | Ducasse George A | $361,100 | |
| Previous Owner | Ducasse George A | $355,000 |
Source: Public Records
Tax History
| Year | Tax Paid | Tax Assessment Tax Assessment Total Assessment is a certain percentage of the fair market value that is determined by local assessors to be the total taxable value of land and additions on the property. | Land | Improvement |
|---|---|---|---|---|
| 2025 | $6,460 | $827,100 | $238,700 | $588,400 |
| 2024 | $5,999 | $748,000 | $227,300 | $520,700 |
| 2023 | $5,842 | $663,100 | $201,200 | $461,900 |
| 2022 | $5,555 | $550,500 | $178,000 | $372,500 |
| 2021 | $5,447 | $505,800 | $162,000 | $343,800 |
| 2020 | $5,316 | $495,000 | $160,500 | $334,500 |
| 2019 | $5,047 | $480,200 | $160,500 | $319,700 |
| 2018 | $4,497 | $426,700 | $145,600 | $281,100 |
| 2017 | $4,479 | $434,900 | $144,200 | $290,700 |
| 2016 | $4,266 | $419,900 | $137,000 | $282,900 |
| 2015 | $4,083 | $405,500 | $122,600 | $282,900 |
Source: Public Records
Map
Nearby Homes
- 566 Shore Rd
- 20 Colony Ave
- 5 Harbor Hill Dr
- 4 Harbor Hill Dr
- 16 Amberwood Ct
- 203 County Rd
- 12 Turnberry Rd Unit 12
- 709 County Rd
- 3 1st St
- 14 Navajo Rd
- 254 Barlows Landing Rd
- 3 4th Ave
- 7 4th Ave
- 2 Applewood Ct
- 13 Laurel Hill Ct
- 4 Hollyhock Knoll Ct Unit 4
- 4 Hollyhock Knoll Ct Unit 4
- 5 Sea Knoll Ct
- 16 Michael Rd
- 5 Zoli Ln
Your Personal Tour Guide
Ask me questions while you tour the home.