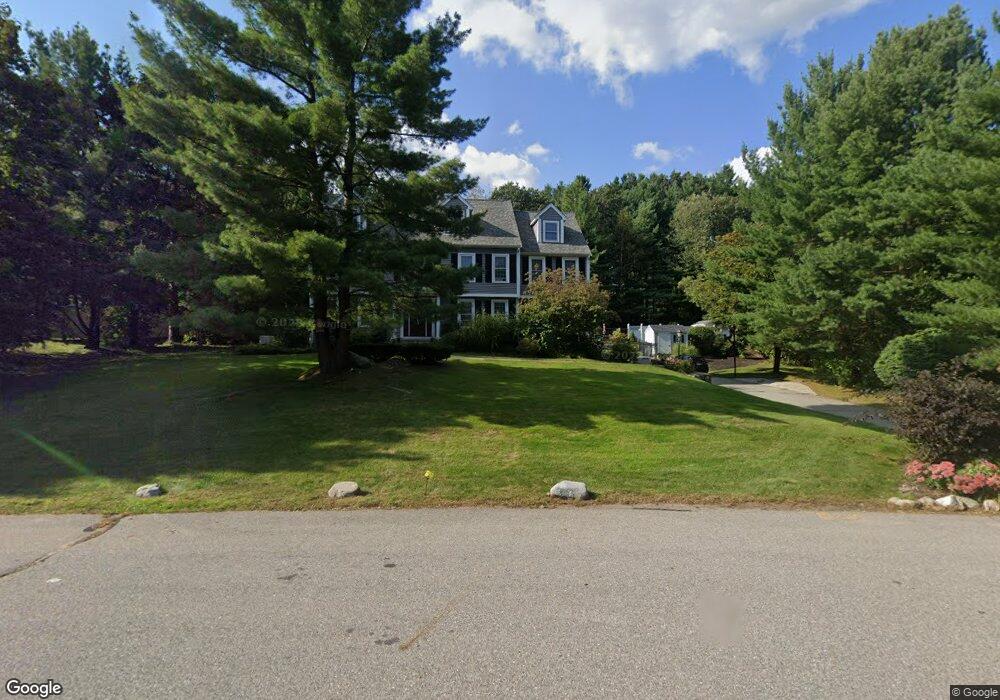
7 Wabanaki Way Andover, MA 01810
West Andover NeighborhoodEstimated Value: $1,306,000 - $1,681,000
4
Beds
3
Baths
3,069
Sq Ft
$474/Sq Ft
Est. Value
About This Home
This home is located at 7 Wabanaki Way, Andover, MA 01810 and is currently estimated at $1,453,499, approximately $473 per square foot. 7 Wabanaki Way is a home located in Essex County with nearby schools including Henry C. Sanborn Elementary School, Andover West Middle School, and Andover High School.
Ownership History
Date
Name
Owned For
Owner Type
Purchase Details
Closed on
Nov 1, 2011
Sold by
Moore Christopher M and Rhee-Moore Soo J
Bought by
Miles David J and Miles Francesca
Current Estimated Value
Home Financials for this Owner
Home Financials are based on the most recent Mortgage that was taken out on this home.
Original Mortgage
$224,000
Outstanding Balance
$153,409
Interest Rate
4.11%
Mortgage Type
Purchase Money Mortgage
Estimated Equity
$1,300,090
Purchase Details
Closed on
Jul 29, 2010
Sold by
Moore Christopher M and Rhee-Moore Soo J
Bought by
Moore Tr Christopher M and Rhee-Moore Soo J
Purchase Details
Closed on
Aug 10, 2009
Sold by
Mcdonough John J and Mcdonough Patricia Murphy
Bought by
Moore Christopher M and Rhee-Moore Soo J
Home Financials for this Owner
Home Financials are based on the most recent Mortgage that was taken out on this home.
Original Mortgage
$523,750
Interest Rate
5.47%
Mortgage Type
Purchase Money Mortgage
Purchase Details
Closed on
Jul 13, 2001
Sold by
Sellig Thomas E and Sellig Tiffany M
Bought by
Mcdonough John J and Mcdonough Patricia M
Home Financials for this Owner
Home Financials are based on the most recent Mortgage that was taken out on this home.
Original Mortgage
$400,000
Interest Rate
7.2%
Mortgage Type
Purchase Money Mortgage
Purchase Details
Closed on
Apr 28, 2000
Sold by
Berquist Kenneth G and Berquist Gail C
Bought by
Sellig Thomas E and Sellig Tiffany M
Home Financials for this Owner
Home Financials are based on the most recent Mortgage that was taken out on this home.
Original Mortgage
$410,000
Interest Rate
8.23%
Mortgage Type
Purchase Money Mortgage
Create a Home Valuation Report for This Property
The Home Valuation Report is an in-depth analysis detailing your home's value as well as a comparison with similar homes in the area
Home Values in the Area
Average Home Value in this Area
Purchase History
| Date | Buyer | Sale Price | Title Company |
|---|---|---|---|
| Miles David J | $779,000 | -- | |
| Moore Tr Christopher M | -- | -- | |
| Moore Christopher M | $760,000 | -- | |
| Mcdonough John J | $651,000 | -- | |
| Sellig Thomas E | $595,000 | -- |
Source: Public Records
Mortgage History
| Date | Status | Borrower | Loan Amount |
|---|---|---|---|
| Open | Miles David J | $224,000 | |
| Previous Owner | Moore Christopher M | $523,750 | |
| Previous Owner | Mcdonough John J | $400,000 | |
| Previous Owner | Sellig Thomas E | $410,000 |
Source: Public Records
Tax History Compared to Growth
Tax History
| Year | Tax Paid | Tax Assessment Tax Assessment Total Assessment is a certain percentage of the fair market value that is determined by local assessors to be the total taxable value of land and additions on the property. | Land | Improvement |
|---|---|---|---|---|
| 2024 | $15,711 | $1,219,800 | $634,100 | $585,700 |
| 2023 | $15,068 | $1,103,100 | $571,100 | $532,000 |
| 2022 | $14,209 | $973,200 | $496,700 | $476,500 |
| 2021 | $13,636 | $891,800 | $451,300 | $440,500 |
| 2020 | $13,119 | $874,000 | $440,200 | $433,800 |
| 2019 | $13,053 | $854,800 | $427,500 | $427,300 |
| 2018 | $12,607 | $806,100 | $411,000 | $395,100 |
| 2017 | $12,108 | $797,600 | $402,800 | $394,800 |
| 2016 | $11,859 | $800,200 | $402,800 | $397,400 |
| 2015 | $11,067 | $739,300 | $387,200 | $352,100 |
Source: Public Records
Map
Nearby Homes
- 18 Bryan Ln Unit 18
- 4 Hazelwood Cir
- 18 Dale St Unit 4G
- 105 Central St
- 103 Central St
- 47 Abbot St
- 3 West Hollow
- 31 Porter Rd
- 25 Timothy Dr
- 4 Hammond Way
- 56 Sunset Rock Rd
- 50 Hidden Rd
- 9 Chapman Ave
- 37 Crenshaw Ln Unit 37
- Lot 7 Weeping Willow Dr
- 42 Stevens St
- 15 Geneva Rd
- 14 Geneva Rd
- 40 Ballardvale Rd
- 38 Lincoln Cir E