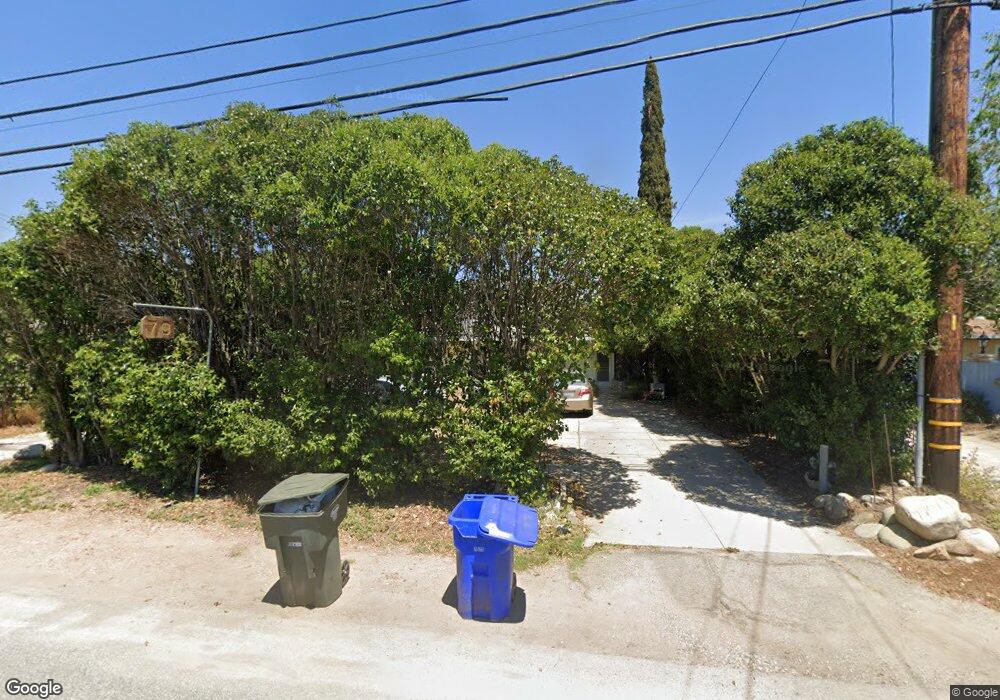
70 Chaparral Rd Oak View, CA 93022
Estimated Value: $665,000 - $1,279,000
3
Beds
3
Baths
1,719
Sq Ft
$558/Sq Ft
Est. Value
About This Home
This home is located at 70 Chaparral Rd, Oak View, CA 93022 and is currently estimated at $959,347, approximately $558 per square foot. 70 Chaparral Rd is a home located in Ventura County with nearby schools including Sunset Elementary School, De Anza Academy Of Technology And The Arts, and Ventura High School.
Ownership History
Date
Name
Owned For
Owner Type
Purchase Details
Closed on
Feb 15, 2024
Sold by
Herschel M And Norma L Johnson Jr Living and Bernard Jona Ann
Bought by
Bakhus Ammar and Bakhus Nayef
Current Estimated Value
Home Financials for this Owner
Home Financials are based on the most recent Mortgage that was taken out on this home.
Original Mortgage
$559,130
Interest Rate
6.94%
Mortgage Type
New Conventional
Purchase Details
Closed on
Nov 9, 2006
Sold by
Johnson Herschel M and Johnson Norma L
Bought by
Johnson Herschel M and Johnson Norma L
Create a Home Valuation Report for This Property
The Home Valuation Report is an in-depth analysis detailing your home's value as well as a comparison with similar homes in the area
Home Values in the Area
Average Home Value in this Area
Purchase History
| Date | Buyer | Sale Price | Title Company |
|---|---|---|---|
| Bakhus Ammar | $658,000 | Fidelity National Title Compan | |
| Johnson Herschel M | -- | Gateway Title Company |
Source: Public Records
Mortgage History
| Date | Status | Borrower | Loan Amount |
|---|---|---|---|
| Previous Owner | Bakhus Ammar | $559,130 |
Source: Public Records
Tax History
| Year | Tax Paid | Tax Assessment Tax Assessment Total Assessment is a certain percentage of the fair market value that is determined by local assessors to be the total taxable value of land and additions on the property. | Land | Improvement |
|---|---|---|---|---|
| 2025 | $1,329 | $670,956 | $436,050 | $234,906 |
| 2024 | $1,329 | $105,846 | $8,109 | $97,737 |
| 2023 | $1,797 | $103,771 | $7,950 | $95,821 |
| 2022 | $1,715 | $101,737 | $7,794 | $93,943 |
| 2021 | $1,691 | $99,743 | $7,642 | $92,101 |
| 2020 | $1,195 | $98,721 | $7,564 | $91,157 |
| 2019 | $1,173 | $96,786 | $7,416 | $89,370 |
| 2018 | $1,154 | $94,889 | $7,271 | $87,618 |
| 2017 | $1,131 | $93,029 | $7,129 | $85,900 |
| 2016 | $1,110 | $91,206 | $6,990 | $84,216 |
| 2015 | $1,025 | $89,838 | $6,886 | $82,952 |
| 2014 | $1,009 | $88,080 | $6,752 | $81,328 |
Source: Public Records
Map
Nearby Homes
- 350 Riverside Rd
- 182 Mountain View St
- 401 Burnham Rd
- 130 Olive St
- 1176 N Ventura Ave
- 543 Good Hope St
- 0 2 Burnham Rd
- 110 E Oak View Ave
- 385 Sunset Ave
- 75 Maxine Ave
- 358 Sunset Ct
- 10505 Dale Ave
- 10980 N Ventura Ave
- 10945 Alto Ct
- 65 Calle Vista Del Monte
- 700 Thomas St
- 10681 Encino Dr
- 1125 Spring St
- 265 Encino Dr
- 11146 N Ventura Ave
- 66 Chaparral Rd
- 72 Chaparral Rd
- 72 Chaparral Rd
- 76 Chaparral Rd
- 75 Chaparral Rd Unit 77
- 78 Chaparral Rd
- 65 Chaparral Rd
- 80 Chaparral Rd
- 57 Chaparral Rd
- 48 Chaparral Rd
- 49 Chaparral Rd
- 193 Riverside Rd
- 193 Riverside Rd
- 172 Burnham Rd
- 34 Chaparral Rd
- 95 Riverside Rd
- 180 Burnham Rd
- 120 Riverside Rd
- 85 Riverside Rd
- 164 Burnham Rd
Your Personal Tour Guide
Ask me questions while you tour the home.