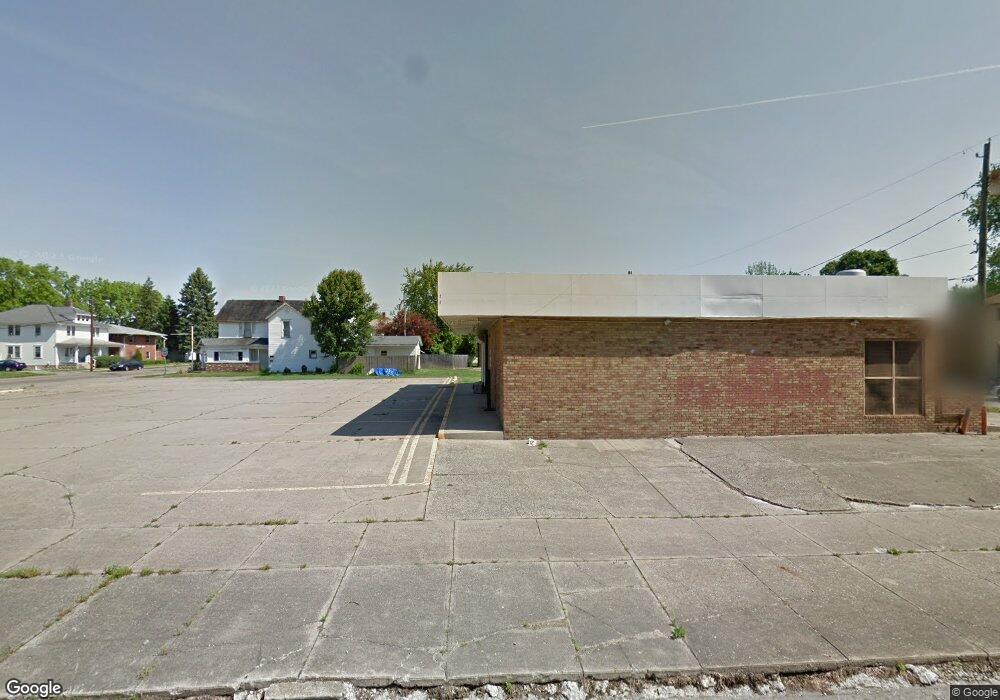
700 N Columbus St Lancaster, OH 43130
--
Bed
--
Bath
2,562
Sq Ft
0.47
Acres
About This Home
This home is located at 700 N Columbus St, Lancaster, OH 43130. 700 N Columbus St is a home located in Fairfield County with nearby schools including Thomas Ewing Junior High School, Lancaster High School, and St Mary Elementary School.
Ownership History
Date
Name
Owned For
Owner Type
Purchase Details
Closed on
Jun 13, 2019
Sold by
Wilson Properties Llc
Bought by
Wilson Jeffrey A and Wilson Jalinda A
Home Financials for this Owner
Home Financials are based on the most recent Mortgage that was taken out on this home.
Original Mortgage
$615,000
Interest Rate
4%
Mortgage Type
Commercial
Purchase Details
Closed on
Apr 10, 2017
Sold by
Patel Praful
Bought by
Wilson Properties Llc
Home Financials for this Owner
Home Financials are based on the most recent Mortgage that was taken out on this home.
Original Mortgage
$282,000
Interest Rate
4.08%
Mortgage Type
Future Advance Clause Open End Mortgage
Purchase Details
Closed on
Mar 3, 2003
Sold by
Forest M Weis Trst
Bought by
Bhatnager Vishnu and Bhatnager Kalpna
Home Financials for this Owner
Home Financials are based on the most recent Mortgage that was taken out on this home.
Original Mortgage
$144,000
Interest Rate
6.07%
Mortgage Type
Commercial
Purchase Details
Closed on
Mar 30, 1993
Sold by
Weis John Harvey
Bought by
Weis John Harvey Rev Inter Viv
Create a Home Valuation Report for This Property
The Home Valuation Report is an in-depth analysis detailing your home's value as well as a comparison with similar homes in the area
Home Values in the Area
Average Home Value in this Area
Purchase History
| Date | Buyer | Sale Price | Title Company |
|---|---|---|---|
| Wilson Jeffrey A | -- | Northwest Ttl Fam Of Compani | |
| Wilson Properties Llc | -- | None Available | |
| Bhatnager Vishnu | $180,000 | -- | |
| Weis John Harvey Rev Inter Viv | -- | -- |
Source: Public Records
Mortgage History
| Date | Status | Borrower | Loan Amount |
|---|---|---|---|
| Closed | Wilson Jeffrey A | $615,000 | |
| Previous Owner | Wilson Properties Llc | $282,000 | |
| Previous Owner | Bhatnager Vishnu | $144,000 |
Source: Public Records
Tax History Compared to Growth
Tax History
| Year | Tax Paid | Tax Assessment Tax Assessment Total Assessment is a certain percentage of the fair market value that is determined by local assessors to be the total taxable value of land and additions on the property. | Land | Improvement |
|---|---|---|---|---|
| 2024 | $6,308 | $70,170 | $14,160 | $56,010 |
| 2023 | $3,820 | $75,100 | $14,160 | $60,940 |
| 2022 | $3,852 | $75,100 | $14,160 | $60,940 |
| 2021 | $3,961 | $75,100 | $14,160 | $60,940 |
| 2020 | $1,792 | $35,140 | $14,160 | $20,980 |
| 2019 | $1,721 | $35,140 | $14,160 | $20,980 |
| 2018 | $1,589 | $35,140 | $14,160 | $20,980 |
| 2017 | $1,585 | $33,230 | $12,250 | $20,980 |
| 2016 | $1,531 | $33,230 | $12,250 | $20,980 |
| 2015 | $1,546 | $33,230 | $12,250 | $20,980 |
| 2014 | $1,478 | $33,230 | $12,250 | $20,980 |
| 2013 | $1,478 | $33,230 | $12,250 | $20,980 |
Source: Public Records
Map
Nearby Homes
- 714 N Columbus St
- 720 N Columbus St
- 710 Maywood Ave
- 640 N Columbus St
- 721 Maywood Ave
- 701 N Columbus St
- 724 N Columbus St Unit 724
- 720 Maywood Ave
- 634 N Columbus St
- 141 W Allen St
- 721 N Columbus St
- 707 N Columbus St
- 711 N Columbus St
- 730 N Columbus St
- 152 Arnold Ave
- 137 W Allen St
- 146 W Allen St
- 146 Arnold Ave
- 630 N Columbus St
- 705 N Columbus St