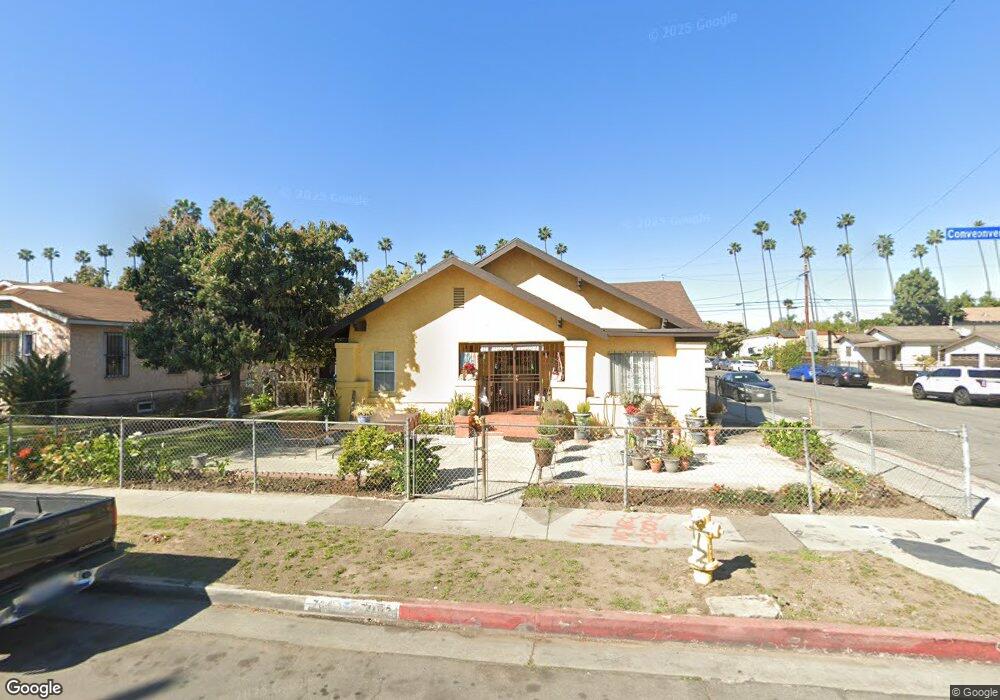
7001 Converse Ave Los Angeles, CA 90001
Estimated Value: $743,000 - $960,234
4
Beds
2
Baths
2,317
Sq Ft
$350/Sq Ft
Est. Value
About This Home
This home is located at 7001 Converse Ave, Los Angeles, CA 90001 and is currently estimated at $811,309, approximately $350 per square foot. 7001 Converse Ave is a home located in Los Angeles County with nearby schools including Miramonte Elementary School, Thomas A. Edison Middle School, and Academy For Multiligual Arts And Science At Mervyn M. Dymally High.
Ownership History
Date
Name
Owned For
Owner Type
Purchase Details
Closed on
Feb 21, 2008
Sold by
Huezo Luis R
Bought by
Huezo Juan C and Huezo Luis R
Current Estimated Value
Home Financials for this Owner
Home Financials are based on the most recent Mortgage that was taken out on this home.
Original Mortgage
$332,000
Outstanding Balance
$204,771
Interest Rate
5.64%
Mortgage Type
New Conventional
Estimated Equity
$606,538
Purchase Details
Closed on
Dec 22, 2004
Sold by
Huezo Maria
Bought by
Huezo Juan C
Home Financials for this Owner
Home Financials are based on the most recent Mortgage that was taken out on this home.
Original Mortgage
$115,000
Interest Rate
5.74%
Mortgage Type
New Conventional
Purchase Details
Closed on
Aug 1, 1996
Sold by
Huezo Juan C and Huezo Luis R
Bought by
Huezo Juan C and Huezo Luis R
Create a Home Valuation Report for This Property
The Home Valuation Report is an in-depth analysis detailing your home's value as well as a comparison with similar homes in the area
Home Values in the Area
Average Home Value in this Area
Purchase History
| Date | Buyer | Sale Price | Title Company |
|---|---|---|---|
| Huezo Juan C | -- | Accommodation | |
| Huezo Luis R | -- | Orange Coast Title | |
| Huezo Juan C | -- | Progressive Title | |
| Huezo Juan C | -- | Southland Title |
Source: Public Records
Mortgage History
| Date | Status | Borrower | Loan Amount |
|---|---|---|---|
| Open | Huezo Luis R | $332,000 | |
| Closed | Huezo Juan C | $115,000 |
Source: Public Records
Tax History Compared to Growth
Tax History
| Year | Tax Paid | Tax Assessment Tax Assessment Total Assessment is a certain percentage of the fair market value that is determined by local assessors to be the total taxable value of land and additions on the property. | Land | Improvement |
|---|---|---|---|---|
| 2025 | $6,867 | $475,880 | $292,946 | $182,934 |
| 2024 | $6,867 | $466,550 | $287,202 | $179,348 |
| 2023 | $6,588 | $457,403 | $281,571 | $175,832 |
| 2022 | $6,298 | $448,435 | $276,050 | $172,385 |
| 2021 | $6,221 | $439,643 | $270,638 | $169,005 |
| 2020 | $6,262 | $435,136 | $267,863 | $167,273 |
| 2019 | $6,038 | $426,605 | $262,611 | $163,994 |
| 2018 | $5,860 | $418,241 | $257,462 | $160,779 |
| 2016 | $5,603 | $402,002 | $247,465 | $154,537 |
| 2015 | $5,520 | $395,964 | $243,748 | $152,216 |
| 2014 | $5,522 | $388,209 | $238,974 | $149,235 |
Source: Public Records
Map
Nearby Homes
- 1715 E 70th St
- 7223 Holmes Ave
- 6203 Compton Ave
- 7114 7116 Miramonte Blvd
- 6601 Miramonte Blvd
- 1524 E 75th St
- 1560 E 66th St
- 7533 Maie Ave
- 6525 Holmes Ave
- 7411 Elsie St
- 7424 Bell Ave
- 1947 E 74th St
- 1315 E 68th St
- 1503 E Gage Ave
- 1734 E 63rd St
- 1413 E 77th St
- 6300 Holmes Ave
- 1144 E 68th St
- 1207 E 76th St
- 1139 E 69th St
- 7005 Converse Ave
- 6921 Converse Ave
- 7011 Converse Ave
- 1610 E 70th St
- 7008 Converse Ave
- 6917 Converse Ave
- 7017 Converse Ave
- 7012 Converse Ave
- 7010 Miramonte Blvd
- 6924 Miramonte Blvd
- 7000 Miramonte Blvd
- 7014 Miramonte Blvd
- 7004 Miramonte Blvd
- 7014 Converse Ave
- 1658 E 70th St
- 6911 Converse Ave
- 7027 Converse Ave
- 1655 E 70th St
- 7020 Miramonte Blvd
- 6916 Miramonte Blvd