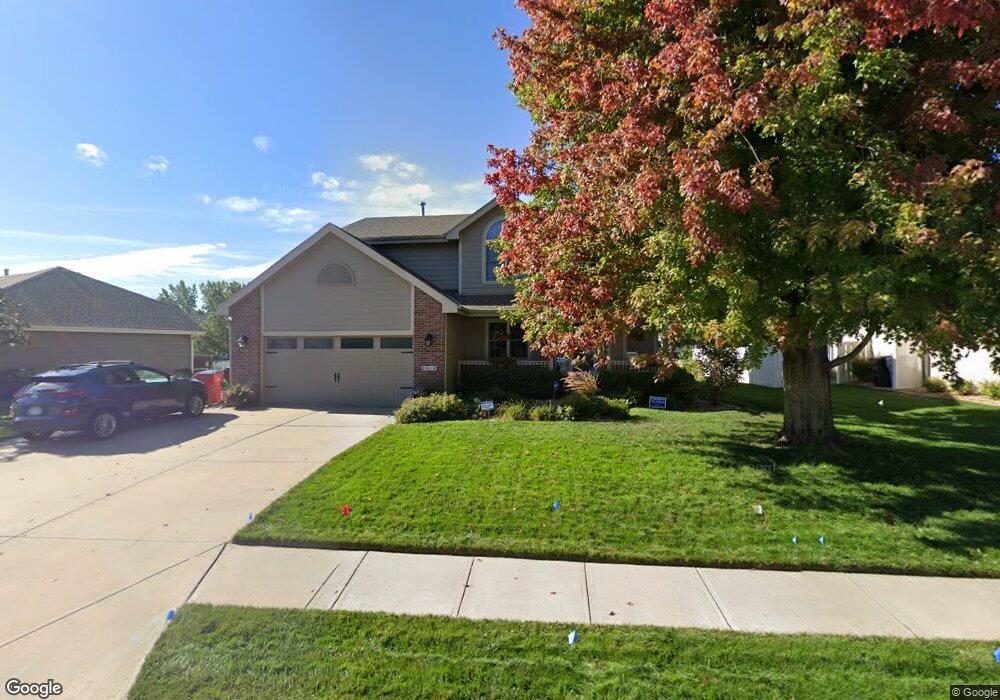
7018 S 167th St Omaha, NE 68136
Millard Park NeighborhoodEstimated Value: $365,790 - $424,000
4
Beds
5
Baths
1,927
Sq Ft
$208/Sq Ft
Est. Value
About This Home
This home is located at 7018 S 167th St, Omaha, NE 68136 and is currently estimated at $400,448, approximately $207 per square foot. 7018 S 167th St is a home located in Sarpy County with nearby schools including Black Elk Elementary School, Beadle Middle School, and Millard West High School.
Ownership History
Date
Name
Owned For
Owner Type
Purchase Details
Closed on
Nov 30, 2010
Sold by
Sundermann Merideth M and Sundermann Dale
Bought by
Sundermann Merideth M and Sundermann Dale A
Current Estimated Value
Home Financials for this Owner
Home Financials are based on the most recent Mortgage that was taken out on this home.
Original Mortgage
$163,000
Interest Rate
4.22%
Purchase Details
Closed on
Mar 25, 2003
Sold by
Labadie Christopher R
Bought by
Labadie Merideth M
Purchase Details
Closed on
Sep 14, 1999
Sold by
Zegers Construction Inc
Bought by
Labadie Christopher R and Labadie Merideth M
Home Financials for this Owner
Home Financials are based on the most recent Mortgage that was taken out on this home.
Original Mortgage
$149,000
Interest Rate
6.75%
Purchase Details
Closed on
May 5, 1999
Sold by
Millard Park Ltd Partnership
Bought by
Zeger Charles R and Zeger Marci J
Create a Home Valuation Report for This Property
The Home Valuation Report is an in-depth analysis detailing your home's value as well as a comparison with similar homes in the area
Home Values in the Area
Average Home Value in this Area
Purchase History
| Date | Buyer | Sale Price | Title Company |
|---|---|---|---|
| Sundermann Merideth M | -- | Prestige Title & Escrow | |
| Labadie Merideth M | -- | -- | |
| Labadie Christopher R | $169,000 | -- | |
| Zeger Charles R | $25,000 | -- |
Source: Public Records
Mortgage History
| Date | Status | Borrower | Loan Amount |
|---|---|---|---|
| Open | Sundermann Merideth M | $163,000 | |
| Closed | Labadie Christopher R | $149,000 |
Source: Public Records
Tax History Compared to Growth
Tax History
| Year | Tax Paid | Tax Assessment Tax Assessment Total Assessment is a certain percentage of the fair market value that is determined by local assessors to be the total taxable value of land and additions on the property. | Land | Improvement |
|---|---|---|---|---|
| 2025 | $5,484 | $328,892 | $56,000 | $272,892 |
| 2024 | $5,705 | $318,243 | $56,000 | $262,243 |
| 2023 | $5,705 | $280,586 | $44,000 | $236,586 |
| 2022 | $5,529 | $255,084 | $42,000 | $213,084 |
| 2021 | $5,238 | $239,055 | $39,000 | $200,055 |
| 2020 | $5,042 | $227,497 | $39,000 | $188,497 |
| 2019 | $5,451 | $222,388 | $39,000 | $183,388 |
| 2018 | $5,282 | $214,359 | $32,000 | $182,359 |
| 2017 | $5,105 | $201,716 | $28,000 | $173,716 |
| 2016 | $4,856 | $190,860 | $28,000 | $162,860 |
| 2015 | $4,727 | $184,846 | $28,000 | $156,846 |
| 2014 | $4,516 | $176,177 | $28,000 | $148,177 |
| 2012 | -- | $175,312 | $28,000 | $147,312 |
Source: Public Records
Map
Nearby Homes
- 7011 S 167th Ave
- 7501 S 166th St
- 16641 Olive St
- 7216 S 170th St
- 7714 S 167th St
- 16113 Josephine St
- 16130 Timberlane Dr
- 7810 S 166th St
- 16125 Timberlane Dr
- 7705 S 169th St
- 7501 S 170th St
- 6328 S 172nd St
- 16904 Joanne Dr
- 7734 S 162nd St
- 16528 Briar St
- 7730 S 161st Terrace
- 16108 Adams St
- 7314 S 174th St
- 16367 Y St
- 6441 S 159th Ave
- 7014 S 167th St
- 7022 S 167th St
- 16706 Gertrude St
- 16710 Gertrude St
- 7026 S 167th St
- 7010 S 167th St
- 16714 Gertrude St
- 7009 S 167th St
- 7005 S 167th St
- 7013 S 167th St
- 7013 S 167th Cr
- 16718 Gertrude St
- 7017 S 167th St
- 7006 S 167th St
- 7021 S 167th St
- 7001 S 167th St
- 16709 Gertrude St
- 7025 S 167th St
- 16705 Gertrude St
- 16713 Gertrude St