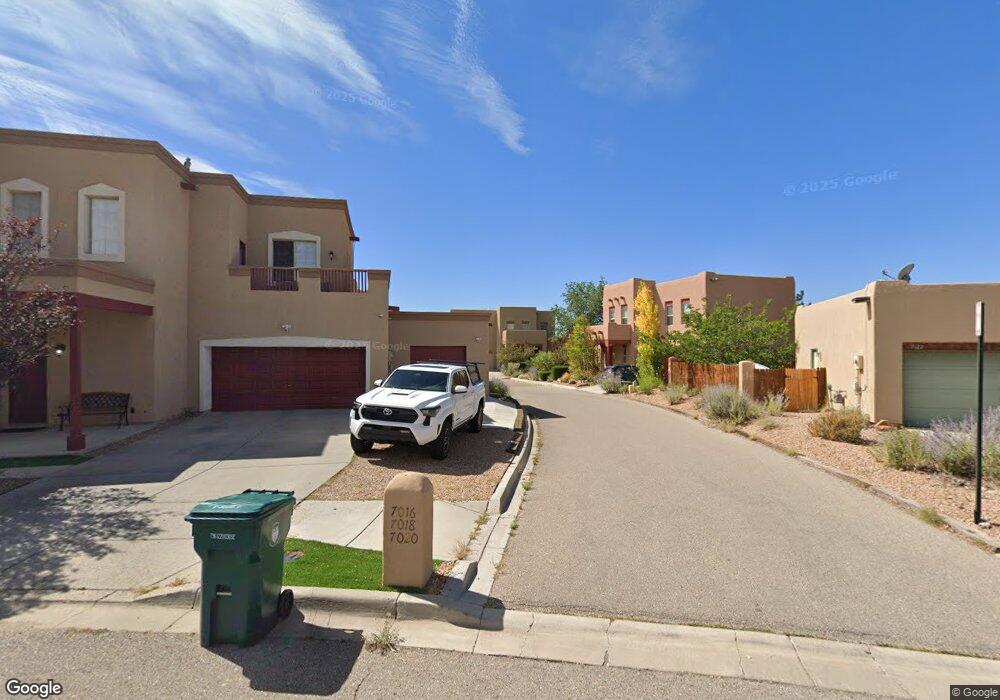
7018 Valentine Loop Santa Fe, NM 87507
Tierra Contenta NeighborhoodEstimated Value: $533,000 - $600,000
3
Beds
3
Baths
2,046
Sq Ft
$270/Sq Ft
Est. Value
About This Home
This home is located at 7018 Valentine Loop, Santa Fe, NM 87507 and is currently estimated at $552,872, approximately $270 per square foot. 7018 Valentine Loop is a home located in Santa Fe County with nearby schools including Nina Otero Community School, Capital High School, and New Mexico Connections Academy.
Ownership History
Date
Name
Owned For
Owner Type
Purchase Details
Closed on
Jul 28, 2016
Sold by
Compton Kathleen Denise and Compton Darryl Lyn
Bought by
Valdez Brian and Valdez Julie Christie
Current Estimated Value
Home Financials for this Owner
Home Financials are based on the most recent Mortgage that was taken out on this home.
Original Mortgage
$273,600
Outstanding Balance
$216,949
Interest Rate
3.54%
Mortgage Type
New Conventional
Estimated Equity
$335,923
Purchase Details
Closed on
Jan 16, 2007
Sold by
Johnston Stan W and Johnston Elizabeth
Bought by
Compton Darryl Lyn and Compton Kathleen Denise
Home Financials for this Owner
Home Financials are based on the most recent Mortgage that was taken out on this home.
Original Mortgage
$238,000
Interest Rate
6.11%
Mortgage Type
Purchase Money Mortgage
Purchase Details
Closed on
Jan 1, 2004
Sold by
Bt Homes Inc
Bought by
Johnston Stan W and Johnston Elizabeth
Create a Home Valuation Report for This Property
The Home Valuation Report is an in-depth analysis detailing your home's value as well as a comparison with similar homes in the area
Home Values in the Area
Average Home Value in this Area
Purchase History
| Date | Buyer | Sale Price | Title Company |
|---|---|---|---|
| Valdez Brian | -- | Stewart Title | |
| Compton Darryl Lyn | -- | Landamerica Capitol City Tit | |
| Johnston Stan W | -- | -- |
Source: Public Records
Mortgage History
| Date | Status | Borrower | Loan Amount |
|---|---|---|---|
| Open | Valdez Brian | $273,600 | |
| Previous Owner | Compton Darryl Lyn | $238,000 |
Source: Public Records
Tax History
| Year | Tax Paid | Tax Assessment Tax Assessment Total Assessment is a certain percentage of the fair market value that is determined by local assessors to be the total taxable value of land and additions on the property. | Land | Improvement |
|---|---|---|---|---|
| 2025 | $2,530 | $333,358 | $67,640 | $265,718 |
| 2024 | $2,466 | $323,649 | $65,670 | $257,979 |
| 2023 | $2,466 | $314,224 | $63,758 | $250,466 |
| 2022 | $2,412 | $305,072 | $61,901 | $243,171 |
| 2021 | $2,375 | $98,729 | $20,032 | $78,697 |
| 2020 | $2,303 | $95,854 | $19,449 | $76,405 |
| 2019 | $2,271 | $93,062 | $18,883 | $74,179 |
| 2018 | $2,221 | $90,352 | $18,333 | $72,019 |
| 2017 | $2,165 | $87,721 | $18,333 | $69,388 |
| 2016 | $1,754 | $73,159 | $18,333 | $54,826 |
| 2015 | $1,713 | $71,028 | $18,333 | $52,695 |
| 2014 | $1,611 | $68,891 | $18,315 | $50,576 |
Source: Public Records
Map
Nearby Homes
- 4725 Sundial Way
- 7000 Camino Rojo
- 6939 Golden Mesa
- 4609 Contenta Ridge
- 7223 Via Verde
- 4650 Camino Cuervo
- 4548 Contenta Ridge
- 4532 Solecito Loop
- 4644 Callejon Lechuza
- 7312 Contenta Ridge
- 6985 Golden Mesa
- 7324 Contenta Ridge
- 7100 Mesa Del Oro
- 6751 Camino Carlita
- 7336 Contenta Ridge
- 4615 Sunset Ridge
- 7340 Contenta Ridge
- 7352 Contenta Ridge
- 7384 Contenta Ridge
- 7388 Contenta Ridge
- 7020 Valentine Loop
- 7016 Valentine Loop
- 7014 Valentine Loop
- 7022 Valentine Loop
- 7029 Vuelta Vistoso
- 7027 Vuelta Vistoso
- 7025 Vuelta Vistoso
- 7031 Vuelta Vistoso
- 4809 Golden Ray Cir
- 4813 Golden Ray Cir
- 4760 Highlands Ct
- 4805 Golden Ray Cir
- 7015 Valentine Loop
- 7023 Vuelta Vistoso
- 7028 Vuelta Vistoso
- 4659 Solecito Loop
- 7033 Vuelta Vistoso
- 7025 Valentine Loop
- 4801 Golden Ray Cir
- 4655 Solecito Loop
Your Personal Tour Guide
Ask me questions while you tour the home.