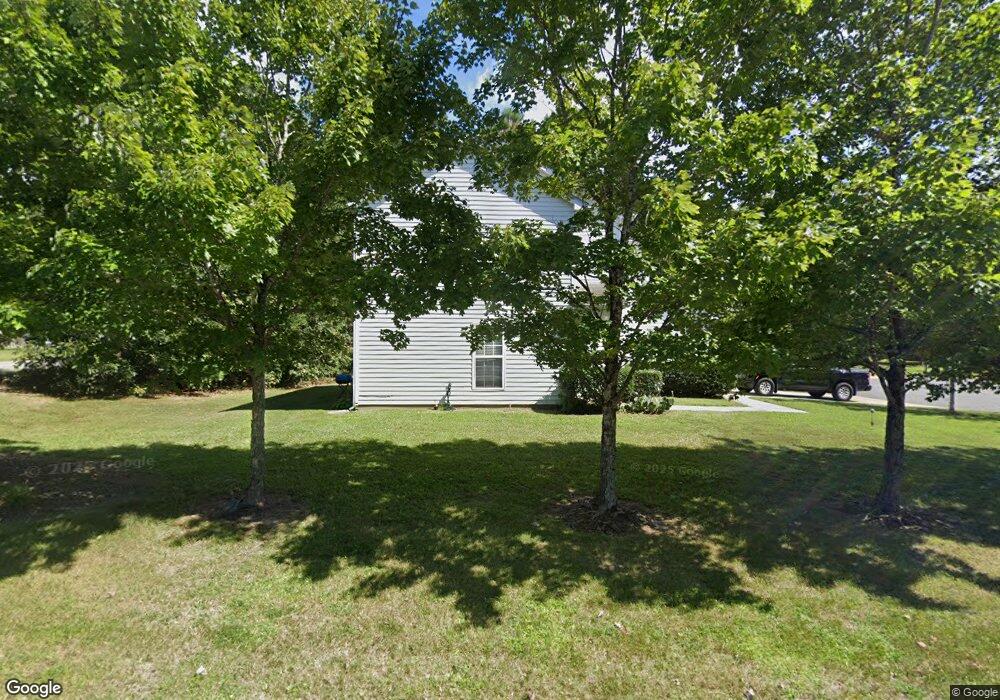
702 Burrell Rd Durham, NC 27703
Eastern Durham NeighborhoodEstimated Value: $309,000 - $331,000
3
Beds
3
Baths
1,392
Sq Ft
$229/Sq Ft
Est. Value
About This Home
This home is located at 702 Burrell Rd, Durham, NC 27703 and is currently estimated at $318,114, approximately $228 per square foot. 702 Burrell Rd is a home located in Durham County with nearby schools including Glenn Elementary, John W Neal Middle School, and Southern School of Energy & Sustainability.
Ownership History
Date
Name
Owned For
Owner Type
Purchase Details
Closed on
Sep 22, 2015
Sold by
American Homes 4 Rent Properties Nine Ll
Bought by
Amh 2015-2 Borrower Llc
Current Estimated Value
Home Financials for this Owner
Home Financials are based on the most recent Mortgage that was taken out on this home.
Original Mortgage
$477,729,000
Outstanding Balance
$374,840,080
Interest Rate
3.88%
Mortgage Type
Future Advance Clause Open End Mortgage
Estimated Equity
-$374,521,966
Purchase Details
Closed on
Jul 9, 2014
Sold by
Andrews Wendell and Wells Fargo Bank Na
Bought by
American Homes 4 Rent Properties Nine Ll
Purchase Details
Closed on
Sep 30, 2002
Sold by
Westfield Homes Of North Carolina Inc
Bought by
Andrews Wendell
Home Financials for this Owner
Home Financials are based on the most recent Mortgage that was taken out on this home.
Original Mortgage
$134,015
Interest Rate
6.19%
Mortgage Type
FHA
Create a Home Valuation Report for This Property
The Home Valuation Report is an in-depth analysis detailing your home's value as well as a comparison with similar homes in the area
Home Values in the Area
Average Home Value in this Area
Purchase History
| Date | Buyer | Sale Price | Title Company |
|---|---|---|---|
| Amh 2015-2 Borrower Llc | -- | Os National Llc | |
| American Homes 4 Rent Properties Nine Ll | $116,760 | None Available | |
| Andrews Wendell | $136,000 | -- |
Source: Public Records
Mortgage History
| Date | Status | Borrower | Loan Amount |
|---|---|---|---|
| Open | Amh 2015-2 Borrower Llc | $477,729,000 | |
| Previous Owner | Andrews Wendell | $134,015 |
Source: Public Records
Tax History
| Year | Tax Paid | Tax Assessment Tax Assessment Total Assessment is a certain percentage of the fair market value that is determined by local assessors to be the total taxable value of land and additions on the property. | Land | Improvement |
|---|---|---|---|---|
| 2025 | $3,293 | $332,213 | $95,700 | $236,513 |
| 2024 | $2,225 | $159,530 | $32,975 | $126,555 |
| 2023 | $2,090 | $159,530 | $32,975 | $126,555 |
| 2022 | $2,042 | $159,530 | $32,975 | $126,555 |
| 2021 | $2,032 | $159,530 | $32,975 | $126,555 |
| 2020 | $1,984 | $159,530 | $32,975 | $126,555 |
| 2019 | $1,984 | $159,530 | $32,975 | $126,555 |
| 2018 | $1,863 | $137,334 | $26,380 | $110,954 |
| 2017 | $1,849 | $137,334 | $26,380 | $110,954 |
| 2016 | $1,787 | $137,334 | $26,380 | $110,954 |
| 2015 | $1,969 | $142,236 | $31,539 | $110,697 |
| 2014 | $1,969 | $142,236 | $31,539 | $110,697 |
Source: Public Records
Map
Nearby Homes
- 913 Valmet Dr
- 608 Chalcedony Ct
- 3900 Mary Martin Rd
- 3822 Mary Martin Rd
- 1005 Sweet Cream Ct
- 1025 Sweet Cream Ct
- 914 Flanders Dr
- 1113 Homecoming Way
- 1060 Gentle Reed Dr
- 1113 Kindness Ln
- 3708 Thornwood Dr
- 507 Lodestone Dr
- 7 Duxford Ct
- 1143 Sweet Cream Ct
- 912 Obsidian Way
- 521 Quartz Dr
- 3511 Thornwood Dr
- 502 Quartz Dr
- 5409 Hadrian Dr
- 1454 Hatteras Rd
Your Personal Tour Guide
Ask me questions while you tour the home.