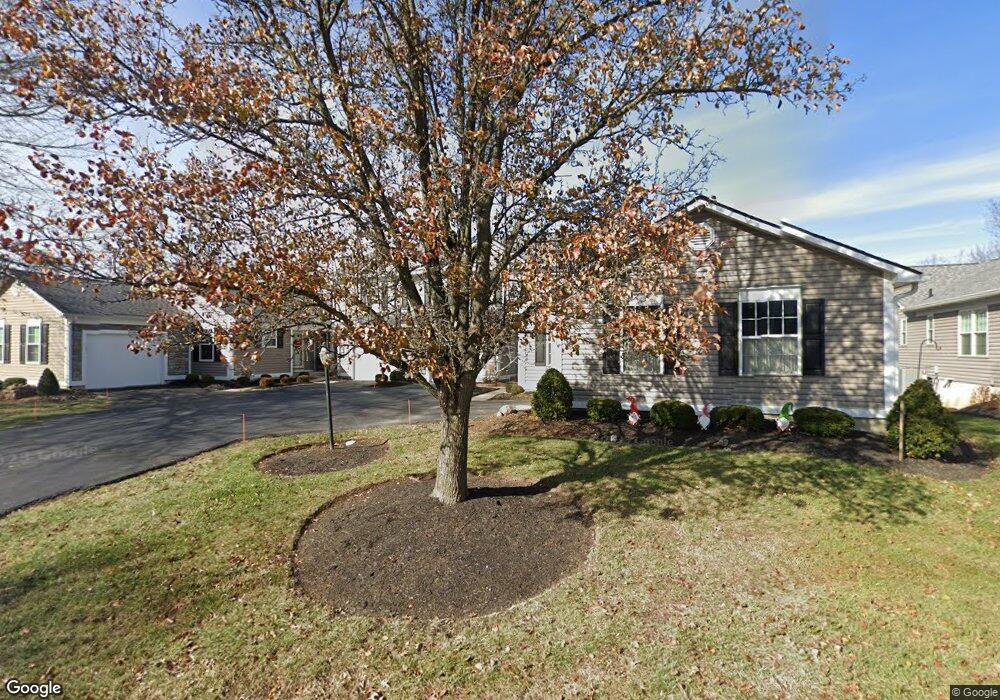
702 Stoneharbor Ln Maineville, OH 45039
Estimated Value: $276,128 - $326,000
2
Beds
3
Baths
1,304
Sq Ft
$230/Sq Ft
Est. Value
About This Home
This home is located at 702 Stoneharbor Ln, Maineville, OH 45039 and is currently estimated at $300,282, approximately $230 per square foot. 702 Stoneharbor Ln is a home located in Warren County with nearby schools including Little Miami Early Childhood Center, Little Miami Intermediate Middle School, and Little Miami Middle School.
Ownership History
Date
Name
Owned For
Owner Type
Purchase Details
Closed on
Jan 27, 2015
Sold by
Jacobs Victoria and Jacobs Bradley C
Bought by
Buck Gary J
Current Estimated Value
Purchase Details
Closed on
Jul 3, 2014
Sold by
Jacobs Victoria and Schiele Sandra J
Bought by
Jacobs Victoria and Jacobs Bradley C
Purchase Details
Closed on
May 7, 2014
Sold by
Estate Of Sandra J Schiele
Bought by
Jacobs Victoria and Schiele Sandra J
Purchase Details
Closed on
May 13, 1993
Sold by
Ware Ware and Ware Carl R
Bought by
Schiele Schiele and Schiele Sandra J
Purchase Details
Closed on
Nov 30, 1988
Sold by
King King and King Robert M
Bought by
Ware Ware and Ware Carl R
Purchase Details
Closed on
Oct 2, 1987
Sold by
Williamsburg Properties &
Bought by
King and King Robert M
Purchase Details
Closed on
Aug 4, 1987
Sold by
Cincinnati Land Developme
Bought by
Williamsburg Properties &
Purchase Details
Closed on
Jul 29, 1987
Sold by
Cincinnati Land Developme
Bought by
Cincinnati Land Developme
Create a Home Valuation Report for This Property
The Home Valuation Report is an in-depth analysis detailing your home's value as well as a comparison with similar homes in the area
Home Values in the Area
Average Home Value in this Area
Purchase History
| Date | Buyer | Sale Price | Title Company |
|---|---|---|---|
| Buck Gary J | $16,667 | Attorney | |
| Jacobs Victoria | -- | None Available | |
| Jacobs Victoria | -- | None Available | |
| Schiele Schiele | $101,000 | -- | |
| Ware Ware | $92,500 | -- | |
| King | $94,100 | -- | |
| Williamsburg Properties & | -- | -- | |
| Cincinnati Land Developme | -- | -- |
Source: Public Records
Tax History
| Year | Tax Paid | Tax Assessment Tax Assessment Total Assessment is a certain percentage of the fair market value that is determined by local assessors to be the total taxable value of land and additions on the property. | Land | Improvement |
|---|---|---|---|---|
| 2025 | $3,295 | $73,680 | $19,250 | $54,430 |
| 2024 | $3,295 | $73,680 | $19,250 | $54,430 |
| 2023 | $2,968 | $58,954 | $10,762 | $48,191 |
| 2022 | $2,924 | $58,954 | $10,763 | $48,192 |
| 2021 | $2,788 | $58,954 | $10,763 | $48,192 |
| 2020 | $2,656 | $47,929 | $8,750 | $39,179 |
| 2019 | $2,699 | $47,929 | $8,750 | $39,179 |
| 2018 | $2,611 | $47,929 | $8,750 | $39,179 |
| 2017 | $2,320 | $40,877 | $7,879 | $32,998 |
| 2016 | $2,366 | $40,877 | $7,879 | $32,998 |
| 2015 | $2,331 | $40,877 | $7,879 | $32,998 |
| 2014 | $2,563 | $39,680 | $7,650 | $32,040 |
| 2013 | $2,520 | $45,410 | $8,750 | $36,660 |
Source: Public Records
Map
Nearby Homes
- 758 Stoneharbor Ln
- 6748 Sandharbor Ct
- 6872 Sandharbor Ct
- 6804 Mossy Rock Ct
- 1068 Beacon Way Ct
- 630 Weeping Willow Ln
- 880 Sunrise Ridge Ct
- 6772 Prairie View Dr
- 6512 Arbor Ct
- 6973 Cottonwood Ct
- 6535 Arbor Ct
- 1103 Grandin Pond Dr
- 1430 Tecumseh Dr
- 6643 Cloudscape Way Unit 8305
- 1790 Amberwood Way
- 1320 Shadowood Trail Unit 21203
- 1 Lot French Ct
- Lot French Ct
- 1443 Windwillow Trace Unit 27203
- 6824 Ohio 48
- 704 Stoneharbor Ln
- 700 Stoneharbor Ln
- 706 Stoneharbor Ln
- 680 Stoneharbor Ln
- 730 Stoneharbor Ln
- 678 Stoneharbor Ln
- 732 Stoneharbor Ln
- 676 Stoneharbor Ln
- 734 Stoneharbor Ln
- 674 Stoneharbor Ln
- 736 Stoneharbor Ln
- 697 Stoneharbor Ln
- 691 Stoneharbor Ln
- 695 Stoneharbor Ln
- 693 Stoneharbor Ln
- 640 Stoneharbor Ln
- 883 Lakeshore Dr
- 754 Stoneharbor Ln
- 638 Stoneharbor Ln
- 733 Stoneharbor Ln
Your Personal Tour Guide
Ask me questions while you tour the home.