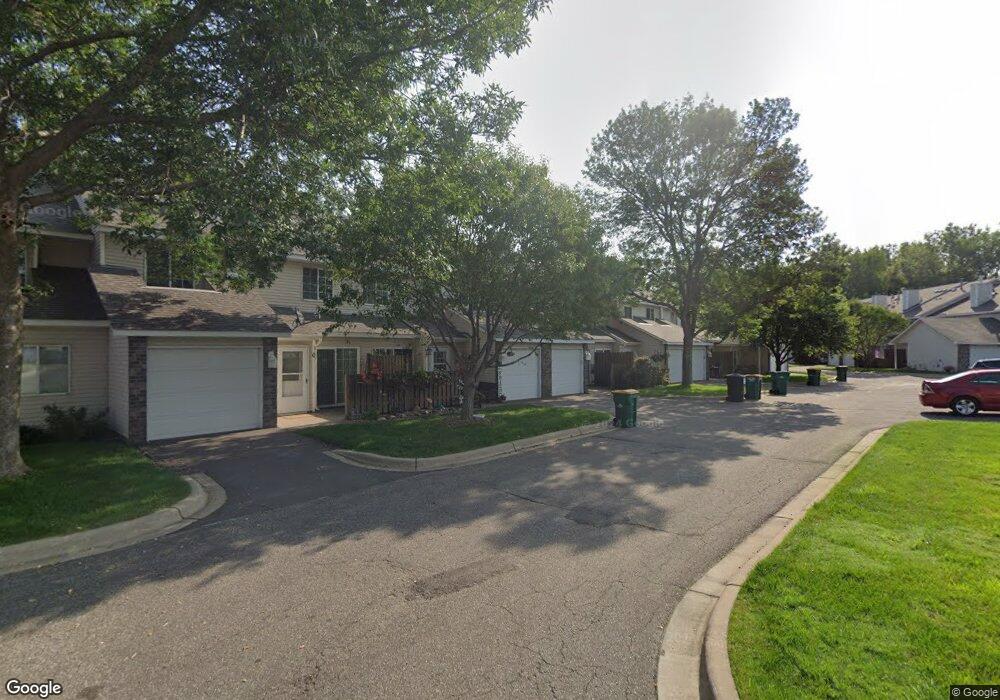
7026 19th St N Unit 6 Saint Paul, MN 55128
Estimated Value: $200,000 - $230,000
2
Beds
1
Bath
1,012
Sq Ft
$207/Sq Ft
Est. Value
About This Home
This home is located at 7026 19th St N Unit 6, Saint Paul, MN 55128 and is currently estimated at $209,417, approximately $206 per square foot. 7026 19th St N Unit 6 is a home located in Washington County with nearby schools including Skyview Community Elementary School, Skyview Community Middle School, and Tartan Senior High School.
Ownership History
Date
Name
Owned For
Owner Type
Purchase Details
Closed on
May 15, 2014
Sold by
Kruger Kristina M
Bought by
Phillippi Kelly M
Current Estimated Value
Home Financials for this Owner
Home Financials are based on the most recent Mortgage that was taken out on this home.
Original Mortgage
$5,100
Outstanding Balance
$3,880
Interest Rate
4.28%
Mortgage Type
Negative Amortization
Estimated Equity
$205,537
Purchase Details
Closed on
May 26, 2005
Sold by
Bruhn Nathan E and Bruhn Lisa J
Bought by
Jechort Jacqueline A
Purchase Details
Closed on
Jul 22, 2003
Sold by
Schroeder Luann
Bought by
Schroeder Lisa J
Purchase Details
Closed on
Mar 31, 2000
Sold by
Valencour Jodi L
Bought by
Schroeder Luann
Purchase Details
Closed on
Jun 30, 1998
Sold by
Kromschroeder Colleen
Bought by
Valencour Jodi L
Purchase Details
Closed on
Jun 30, 1997
Sold by
Babich Peter and Babich Dorothy E
Bought by
Kromschroeder Colleen A
Create a Home Valuation Report for This Property
The Home Valuation Report is an in-depth analysis detailing your home's value as well as a comparison with similar homes in the area
Home Values in the Area
Average Home Value in this Area
Purchase History
| Date | Buyer | Sale Price | Title Company |
|---|---|---|---|
| Phillippi Kelly M | $103,000 | Edina Realty Title Inc | |
| Jechort Jacqueline A | $152,900 | -- | |
| Schroeder Lisa J | $139,000 | -- | |
| Schroeder Luann | $93,000 | -- | |
| Valencour Jodi L | $80,250 | -- | |
| Kromschroeder Colleen A | $74,900 | -- |
Source: Public Records
Mortgage History
| Date | Status | Borrower | Loan Amount |
|---|---|---|---|
| Open | Phillippi Kelly M | $5,100 | |
| Open | Phillippi Kelly M | $101,134 |
Source: Public Records
Tax History Compared to Growth
Tax History
| Year | Tax Paid | Tax Assessment Tax Assessment Total Assessment is a certain percentage of the fair market value that is determined by local assessors to be the total taxable value of land and additions on the property. | Land | Improvement |
|---|---|---|---|---|
| 2024 | $2,096 | $201,700 | $65,000 | $136,700 |
| 2023 | $2,096 | $191,500 | $60,000 | $131,500 |
| 2022 | $1,674 | $177,900 | $59,300 | $118,600 |
| 2021 | $1,546 | $157,600 | $52,500 | $105,100 |
| 2020 | $1,526 | $147,200 | $47,500 | $99,700 |
| 2019 | $1,308 | $142,600 | $42,500 | $100,100 |
| 2018 | $1,220 | $126,600 | $35,000 | $91,600 |
| 2017 | $1,160 | $118,700 | $33,000 | $85,700 |
| 2016 | $1,036 | $109,200 | $25,000 | $84,200 |
| 2015 | $870 | $64,100 | $12,400 | $51,700 |
| 2013 | -- | $50,900 | $8,800 | $42,100 |
Source: Public Records
Map
Nearby Homes
- 2001 Gresham Ave N Unit 18
- 2059 Gresham Ave N
- 2181 Helena Rd N
- 2056 Gresham Ave N
- 1979 Helena Ct N
- 2209 Henna Ave N
- 2332 Gresham Ave N
- 1612 Helena Rd N
- 6551 22nd St N
- 1580 Helmo Ave N Unit 1580
- 2477 Grenadier Ave N
- 2249 Heath Ave N
- 7603 19th St N
- 2404 Helena Ave N
- 6671 Stillwater Blvd N
- 6510 23rd St N
- 7454 Upper 24th St N
- 1306 Guthrie Ave N
- 2569 Hayward Ave N
- 6374 Gopher Blvd N
- 7026 19th St N Unit 7
- 7026 19th St N Unit 12
- 7026 19th St N Unit 3
- 7026 19th St N Unit 5
- 7026 19th St N Unit 8
- 7026 19th St N Unit 14
- 7026 19th St N Unit 13
- 7026 19th St N Unit 4
- 7026 19th St N Unit 11
- 7026 19th St N Unit 10
- 7026 19th St N Unit 1
- 7018 19th St N Unit 8
- 7018 19th St N Unit 2
- 7018 19th St N Unit 9
- 7018 19th St N Unit 5
- 7018 19th St N Unit 12
- 7018 19th St N Unit 3
- 7018 19th St N Unit 7
- 7018 19th St N Unit 6
- 7018 19th St N Unit 11