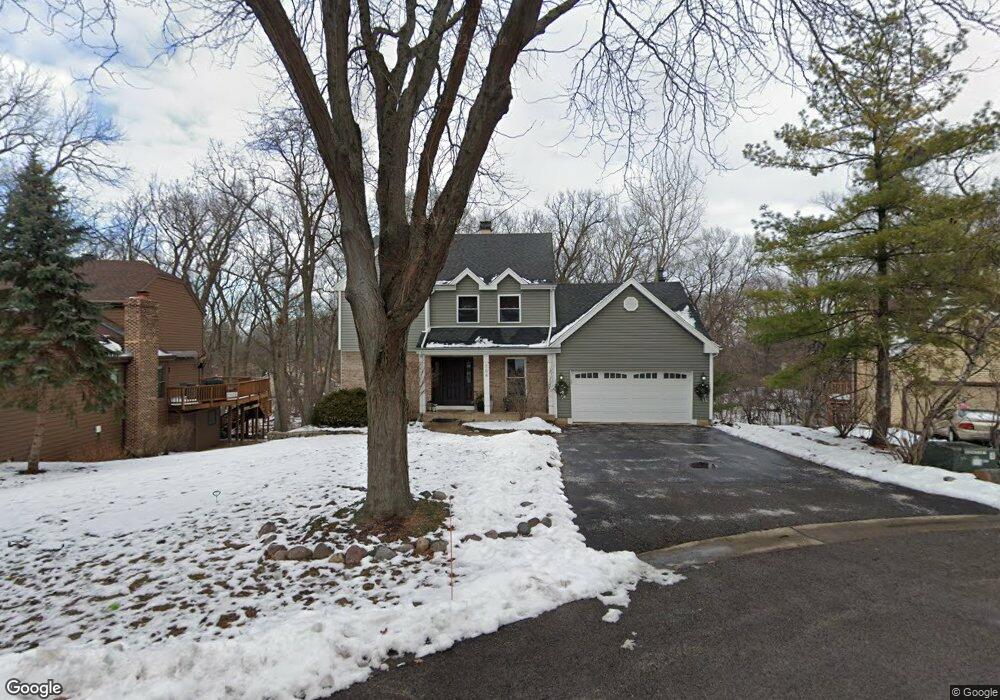
704 Hackberry Ct Unit 2 Bartlett, IL 60103
Estimated Value: $480,000 - $551,000
3
Beds
4
Baths
2,182
Sq Ft
$241/Sq Ft
Est. Value
About This Home
This home is located at 704 Hackberry Ct Unit 2, Bartlett, IL 60103 and is currently estimated at $526,075, approximately $241 per square foot. 704 Hackberry Ct Unit 2 is a home located in Cook County with nearby schools including Bartlett Elementary School, Eastview Middle School, and South Elgin High School.
Ownership History
Date
Name
Owned For
Owner Type
Purchase Details
Closed on
Jul 30, 2004
Sold by
Phillips Thomas A and Phillips Carol J
Bought by
Arnold Peter J and Arnold Junko K
Current Estimated Value
Home Financials for this Owner
Home Financials are based on the most recent Mortgage that was taken out on this home.
Original Mortgage
$293,520
Outstanding Balance
$144,736
Interest Rate
6.35%
Mortgage Type
New Conventional
Estimated Equity
$381,339
Purchase Details
Closed on
Nov 15, 1995
Sold by
Phillips Thomas A
Bought by
Phillips Thomas A and Phillips Carol J
Purchase Details
Closed on
Sep 30, 1993
Sold by
Gonzalez Efrain and Gonzalez Debra
Bought by
Phillips Thomas A
Home Financials for this Owner
Home Financials are based on the most recent Mortgage that was taken out on this home.
Original Mortgage
$181,200
Interest Rate
7.15%
Create a Home Valuation Report for This Property
The Home Valuation Report is an in-depth analysis detailing your home's value as well as a comparison with similar homes in the area
Home Values in the Area
Average Home Value in this Area
Purchase History
| Date | Buyer | Sale Price | Title Company |
|---|---|---|---|
| Arnold Peter J | $367,000 | Stewart Title Of Illinois | |
| Phillips Thomas A | -- | -- | |
| Phillips Thomas A | $226,500 | -- |
Source: Public Records
Mortgage History
| Date | Status | Borrower | Loan Amount |
|---|---|---|---|
| Open | Arnold Peter J | $293,520 | |
| Previous Owner | Phillips Thomas A | $181,200 |
Source: Public Records
Tax History
| Year | Tax Paid | Tax Assessment Tax Assessment Total Assessment is a certain percentage of the fair market value that is determined by local assessors to be the total taxable value of land and additions on the property. | Land | Improvement |
|---|---|---|---|---|
| 2025 | $11,068 | $47,000 | $18,355 | $28,645 |
| 2024 | $11,068 | $37,532 | $16,061 | $21,471 |
| 2023 | $10,657 | $37,532 | $16,061 | $21,471 |
| 2022 | $10,657 | $37,532 | $16,061 | $21,471 |
| 2021 | $9,120 | $27,275 | $13,766 | $13,509 |
| 2020 | $9,066 | $27,275 | $13,766 | $13,509 |
| 2019 | $9,003 | $30,306 | $13,766 | $16,540 |
| 2018 | $9,133 | $28,359 | $12,045 | $16,314 |
| 2017 | $9,908 | $30,919 | $12,045 | $18,874 |
| 2016 | $9,539 | $30,919 | $12,045 | $18,874 |
| 2015 | $8,880 | $27,067 | $10,898 | $16,169 |
| 2014 | $8,774 | $27,067 | $10,898 | $16,169 |
| 2013 | $9,366 | $29,801 | $10,898 | $18,903 |
Source: Public Records
Map
Nearby Homes
- 6 Dartmouth Ct
- 122 Brittany Dr Unit 16C2
- 2074 Essex Ct Unit 2074
- 420 Ford Ln
- 129 Southwicke Dr Unit B
- 179 Locksley Dr
- 282 Monarch Dr Unit 24
- 377 Locksley Dr
- 105 Heritage Ln Unit 173T105
- 132 Meredith Ln Unit 63
- 629 W Streamwood Blvd Unit B
- 741 W Streamwood Blvd Unit A
- 1352 Laurel Oaks Dr Unit 3B
- 304 Patricia Ln
- 319 W Streamwood Blvd
- 5011 Valley Ln Unit 204
- 1116 Tuscany Dr
- 201 W Streamwood Blvd
- SWC Illinois Route 59
- 820 S Pine St
- 708 Hackberry Ct
- 702 Hackberry Ct
- 712 Hackberry Ct
- 709 Hackberry Ct
- 701 Hackberry Ct
- 713 Hackberry Ct
- 703 Hackberry Ct
- 714 Hackberry Ct
- 705 Hackberry Ct
- 717 Hackberry Ct
- 718 Hackberry Ct
- 716 Red Bud Ct
- 1121 Oak Ridge Dr
- 1119 Oak Ridge Dr
- 721 Hackberry Ct
- 1123 Oak Ridge Dr
- 1125 Oak Ridge Dr
- 720 Red Bud Ct
- 1127 Oak Ridge Dr
- 715 Red Bud Ct
Your Personal Tour Guide
Ask me questions while you tour the home.