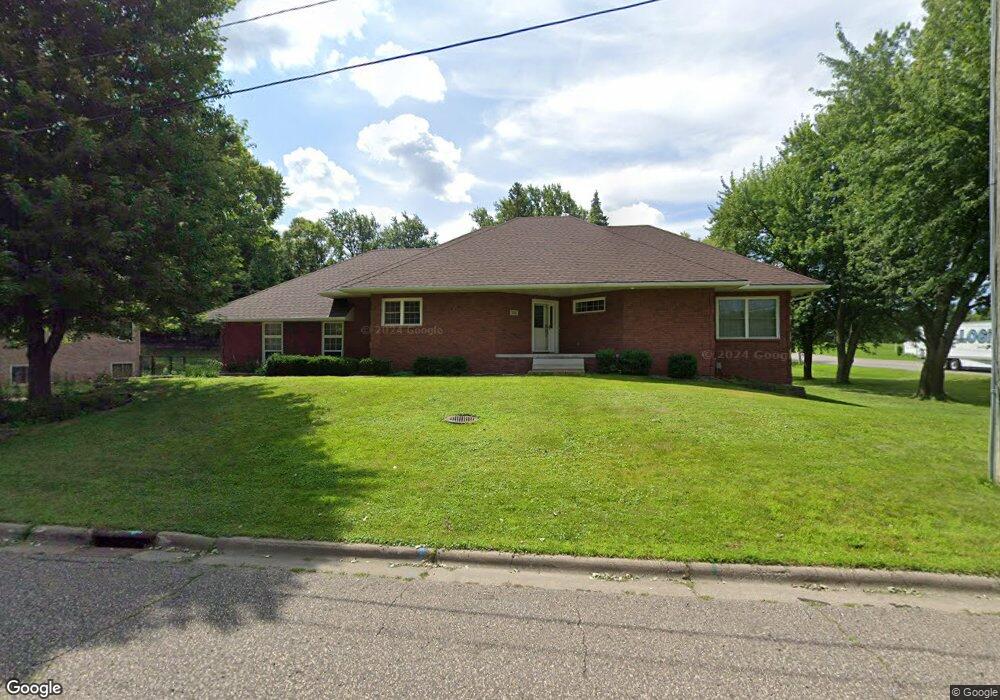
7041 30th St N Saint Paul, MN 55128
Estimated Value: $446,000 - $467,000
3
Beds
3
Baths
3,040
Sq Ft
$151/Sq Ft
Est. Value
About This Home
This home is located at 7041 30th St N, Saint Paul, MN 55128 and is currently estimated at $460,401, approximately $151 per square foot. 7041 30th St N is a home located in Washington County with nearby schools including Eagle Point Elementary School, Skyview Community Middle School, and Tartan Senior High School.
Ownership History
Date
Name
Owned For
Owner Type
Purchase Details
Closed on
Jul 16, 2021
Sold by
Berchem Branden and Ali Berchem Sama
Bought by
Xiong Va and Lee Ywjpheej Jonathan
Current Estimated Value
Home Financials for this Owner
Home Financials are based on the most recent Mortgage that was taken out on this home.
Original Mortgage
$384,750
Outstanding Balance
$349,632
Interest Rate
3%
Mortgage Type
New Conventional
Estimated Equity
$110,769
Purchase Details
Closed on
Oct 14, 2016
Sold by
Oldenkamp Mark and Oldekamp Danielle
Bought by
Berchem Branden and Ale Berchem Sama
Purchase Details
Closed on
Nov 15, 2012
Sold by
Biagini Richard K
Bought by
Oldenkamp Mark and Oldenkamp Danielle
Home Financials for this Owner
Home Financials are based on the most recent Mortgage that was taken out on this home.
Original Mortgage
$293,500
Interest Rate
3.3%
Mortgage Type
FHA
Purchase Details
Closed on
Jul 27, 2006
Sold by
Biagini Richard A and Biagini Eileen E
Bought by
Biagini Richard K
Create a Home Valuation Report for This Property
The Home Valuation Report is an in-depth analysis detailing your home's value as well as a comparison with similar homes in the area
Home Values in the Area
Average Home Value in this Area
Purchase History
| Date | Buyer | Sale Price | Title Company |
|---|---|---|---|
| Xiong Va | $405,000 | Arden Title Llc | |
| Berchem Branden | $314,900 | Cities Title Services Llc | |
| Oldenkamp Mark | $299,000 | Cities Title | |
| Biagini Richard K | $360,000 | -- | |
| Lee Ywjpheej Ywjpheej | $405,000 | -- |
Source: Public Records
Mortgage History
| Date | Status | Borrower | Loan Amount |
|---|---|---|---|
| Open | Xiong Va | $384,750 | |
| Previous Owner | Oldenkamp Mark | $293,500 | |
| Closed | Lee Ywjpheej Ywjpheej | $384,750 |
Source: Public Records
Tax History Compared to Growth
Tax History
| Year | Tax Paid | Tax Assessment Tax Assessment Total Assessment is a certain percentage of the fair market value that is determined by local assessors to be the total taxable value of land and additions on the property. | Land | Improvement |
|---|---|---|---|---|
| 2024 | $5,342 | $457,000 | $120,000 | $337,000 |
| 2023 | $5,342 | $486,200 | $130,000 | $356,200 |
| 2022 | $4,250 | $424,300 | $100,800 | $323,500 |
| 2021 | $4,356 | $351,900 | $85,000 | $266,900 |
| 2020 | $4,358 | $358,700 | $95,500 | $263,200 |
| 2019 | $4,028 | $352,800 | $91,000 | $261,800 |
| 2018 | $3,826 | $328,600 | $85,000 | $243,600 |
| 2017 | $3,938 | $313,500 | $84,000 | $229,500 |
| 2016 | $4,088 | $306,300 | $76,000 | $230,300 |
| 2015 | $4,418 | $283,900 | $68,400 | $215,500 |
| 2013 | -- | $259,600 | $53,100 | $206,500 |
Source: Public Records
Map
Nearby Homes
- 6591 30th Street Ct N
- 6920 35th St N
- 2569 Hayward Ave N
- 7571 Stillwater Way N
- 2477 Grenadier Ave N
- 3565 Gresham Ave N
- 2839 Henslow Ave N
- 2678 Henslow Ave N
- 7650 Stillwater Way N
- 7011 Upper 36th St N
- 7492 Upper 24th St N
- 7602 26th St N
- 2404 Helena Ave N
- 3507 Goodwin Ave N
- 3592 Garden Blvd N
- 2059 Gresham Ave N
- 2033 Gresham Ave N
- 2056 Gresham Ave N
- 2001 Gresham Ave N Unit 18
- 2590 Glenbrook Ave N
- 7041 7041 30th-Street-n
- 7041 7041 N 30th-Street-n
- 2969 Hadley Ave N
- 7051 30th St N
- 2957 Hadley Ave N
- 7061 30th St N
- 7040 30th St N
- 2935 Hadley Ave N
- 2921 Hadley Ave N
- 7048 30th St N
- 7048 7048 30th-Street-n
- 2982 Hallmark Ave N
- 2968 Hallmark Ave N
- 3000 Hadley Ave N
- 7081 30th St N
- 2942 Hallmark Ave N
- 2901 Hadley Ave N
- 2889 Hadley Ave N
- 6993 29th St N
- 2985 Hallmark Ave N