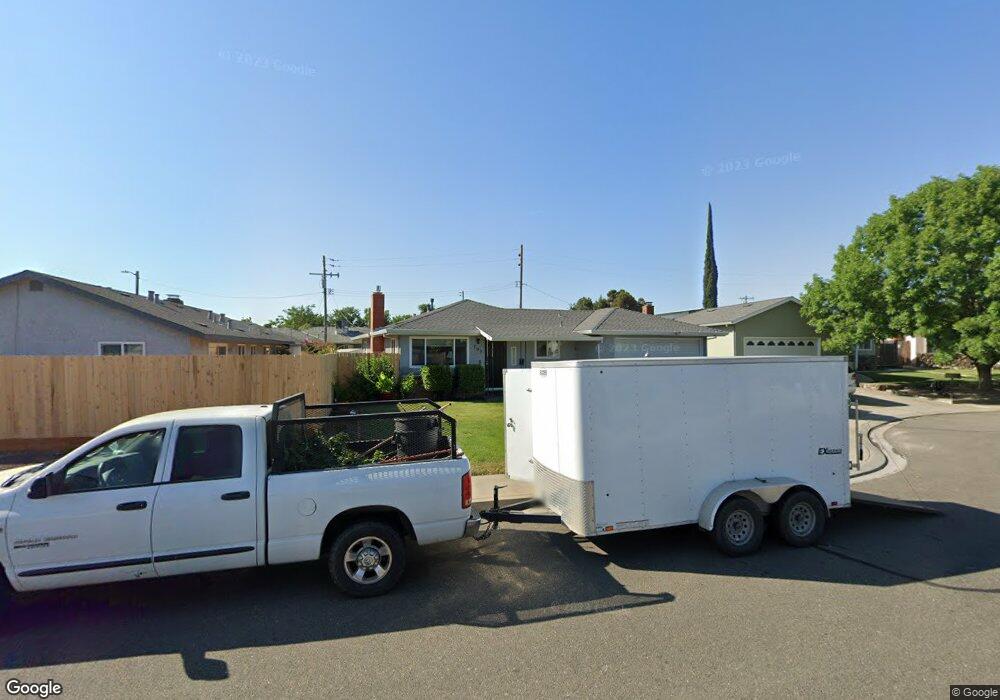
705 Cloverland Ct Oakdale, CA 95361
Estimated Value: $316,000 - $420,000
3
Beds
2
Baths
1,221
Sq Ft
$318/Sq Ft
Est. Value
About This Home
This home is located at 705 Cloverland Ct, Oakdale, CA 95361 and is currently estimated at $388,757, approximately $318 per square foot. 705 Cloverland Ct is a home located in Stanislaus County with nearby schools including Cloverland Elementary School, Oakdale Junior High School, and Oakdale High School.
Ownership History
Date
Name
Owned For
Owner Type
Purchase Details
Closed on
Mar 10, 2021
Sold by
White Carol C and The Bobby F And Carol C White
Bought by
White Carol C and The Bobby F And Carol C White
Current Estimated Value
Home Financials for this Owner
Home Financials are based on the most recent Mortgage that was taken out on this home.
Original Mortgage
$131,500
Outstanding Balance
$97,470
Interest Rate
2.7%
Mortgage Type
New Conventional
Estimated Equity
$291,287
Purchase Details
Closed on
Jul 28, 2014
Sold by
Bryant Tammy L and White Carol C
Bought by
White Carol C and The Bobby F & Carol C White Tr
Purchase Details
Closed on
Mar 19, 2012
Sold by
Bryant Tammy L
Bought by
Bryant Tammy L and White Carol C
Purchase Details
Closed on
Jul 26, 2011
Sold by
White Bobby F and White Carol C
Bought by
Bryant Tammy L
Purchase Details
Closed on
Jan 10, 2006
Sold by
White Bobby F and White Carol C
Bought by
White Bobby F and White Carol C
Create a Home Valuation Report for This Property
The Home Valuation Report is an in-depth analysis detailing your home's value as well as a comparison with similar homes in the area
Home Values in the Area
Average Home Value in this Area
Purchase History
We collect this data history from publicly available records. To have your information removed, we recommend requesting removal directly through your county’s website.
| Date | Buyer | Sale Price | Title Company |
|---|---|---|---|
| White Carol C | -- | Chicago Title Company | |
| White Carol C | -- | None Available | |
| Bryant Tammy L | -- | None Available | |
| Bryant Tammy L | -- | None Available | |
| White Bobby F | -- | None Available |
Source: Public Records
Mortgage History
We collect this data history from publicly available records. To have your information removed, we recommend requesting removal directly through your county’s website.
| Date | Status | Borrower | Loan Amount |
|---|---|---|---|
| Open | White Carol C | $131,500 |
Source: Public Records
Tax History
| Year | Tax Paid | Tax Assessment Tax Assessment Total Assessment is a certain percentage of the fair market value that is determined by local assessors to be the total taxable value of land and additions on the property. | Land | Improvement |
|---|---|---|---|---|
| 2025 | $856 | $83,737 | $13,504 | $70,233 |
| 2024 | $811 | $82,096 | $13,240 | $68,856 |
| 2023 | $792 | $80,487 | $12,981 | $67,506 |
| 2022 | $777 | $78,910 | $12,727 | $66,183 |
| 2021 | $763 | $77,364 | $12,478 | $64,886 |
| 2020 | $830 | $76,572 | $12,351 | $64,221 |
| 2019 | $817 | $75,071 | $12,109 | $62,962 |
| 2018 | $806 | $73,600 | $11,872 | $61,728 |
| 2017 | $792 | $72,158 | $11,640 | $60,518 |
| 2016 | $778 | $70,744 | $11,412 | $59,332 |
| 2015 | $768 | $69,682 | $11,241 | $58,441 |
| 2014 | $761 | $68,318 | $11,021 | $57,297 |
Source: Public Records
Map
Nearby Homes
- 900 Old Stockton Rd Unit 124
- 861 River Bluff Ct
- 1149 River Bluff Dr
- 1213 E A St
- 1174 River Bluff Dr
- 1251 David Dr
- 721 River Ave
- 454 N 3rd Ave
- 414 Valley View Dr
- 250 N 9th Ave
- 1253 River Bluff Dr
- 228 N 5th Ave
- 1242 River Bluff Dr
- 368 Nutcrest Ct
- 328 N 3rd Ave
- 921 E E St
- 880 E F St Unit 14
- 880 E F St Unit 8
- 1356 Cindy Dr
- 710 Almondcrest St
- 707 Cloverland Ct
- 670 Cloverland Way
- 709 Cloverland Ct
- 652 Cloverland Way
- 718 Cloverland Ct
- 711 Cloverland Ct
- 695 Cloverland Way
- 636 Cloverland Way
- 640 E A St
- 713 Cloverland Way
- 732 Cloverland Way
- 714 Cloverland Ct
- 649 Cloverland Way
- 716 Cloverland Ct
- 701 Smithwood Dr
- 723 Smithwood Dr
- 681 Cloverland Way
- 755 Smithwood Dr
- 788 E A St
- 731 Cloverland Way
Your Personal Tour Guide
Ask me questions while you tour the home.